

Venezuela holds the world's largest proven oil reserves—much of it in the Orinoco Belt's extra-heavy crude—yet production has collapsed over the past two decades amid underinvestment, sanctions, and political turmoil. Understanding where those reserves and production capacities sit today, which basins and fields dominate, and who operates them is essential for anyone tracking global oil markets or Latin American energy. This post uses the Venezuela Oil Reservoirs and Fields 2026 dataset by mjawad17 on Kaggle to map reserves and production capacity by basin, oil type, field status, and operator, and to put key numbers and trends in one place.
We walk through the data at a glance, where the oil is (basins and geography), what kind of oil (grades and types), the lifecycle of fields (status), who operates what, when fields were discovered, the top assets by reserves and capacity, and the relationship between reserves and capacity. A short data and methodology note at the end explains how the figures were produced and how to interpret them.

The data at a glance
The dataset covers 23 entries: 22 individual reservoirs or field groupings plus one aggregate row for the Orinoco Belt as a whole. Across 7 basins or regions, the data sum to roughly 390.5 billion barrels of proven reserves and about 247 billion barrels of estimated recoverable reserves (using midpoints where the source reports a range). Total reported production capacity is 4.165 million barrels per day. The summary figure below captures these headline numbers.
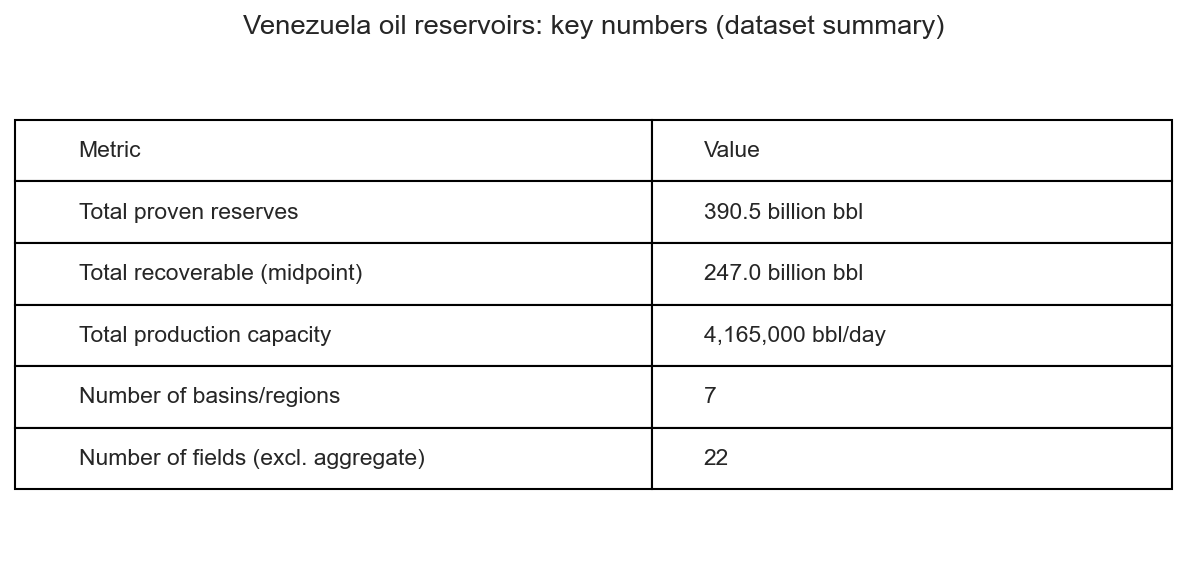
One caveat: the Orinoco Belt (Total) row is an aggregate (235 billion barrels proven, 100–270 billion recoverable, 400 thousand bbl/day capacity in the source). It is included in basin-level totals so that the Orinoco Belt’s share is visible alongside other basins; for per-field charts we exclude this row to avoid double-counting and to focus on named fields and projects.
Where the oil is: basins and geography
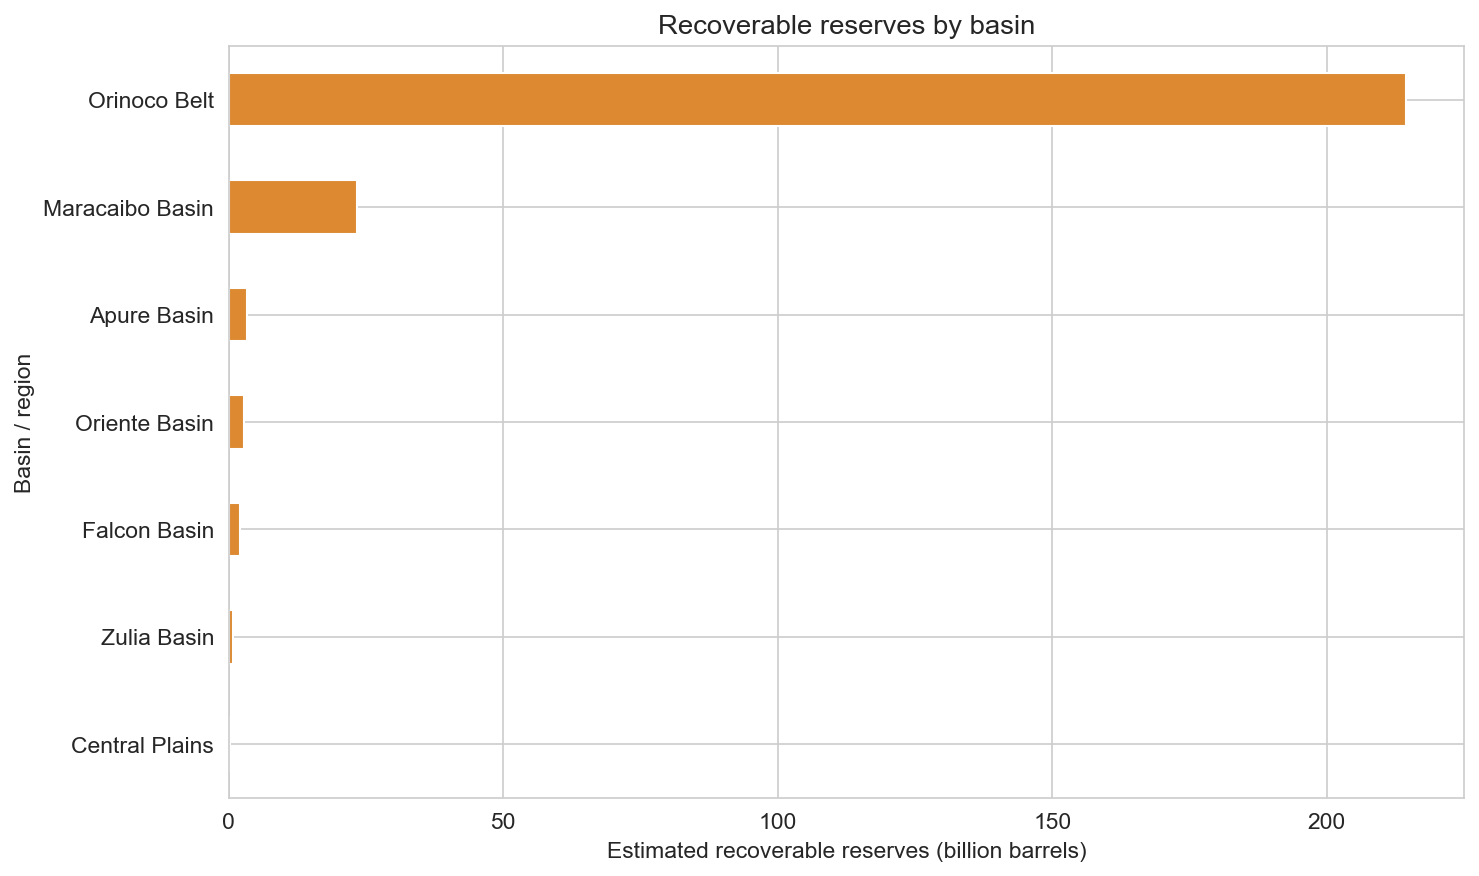
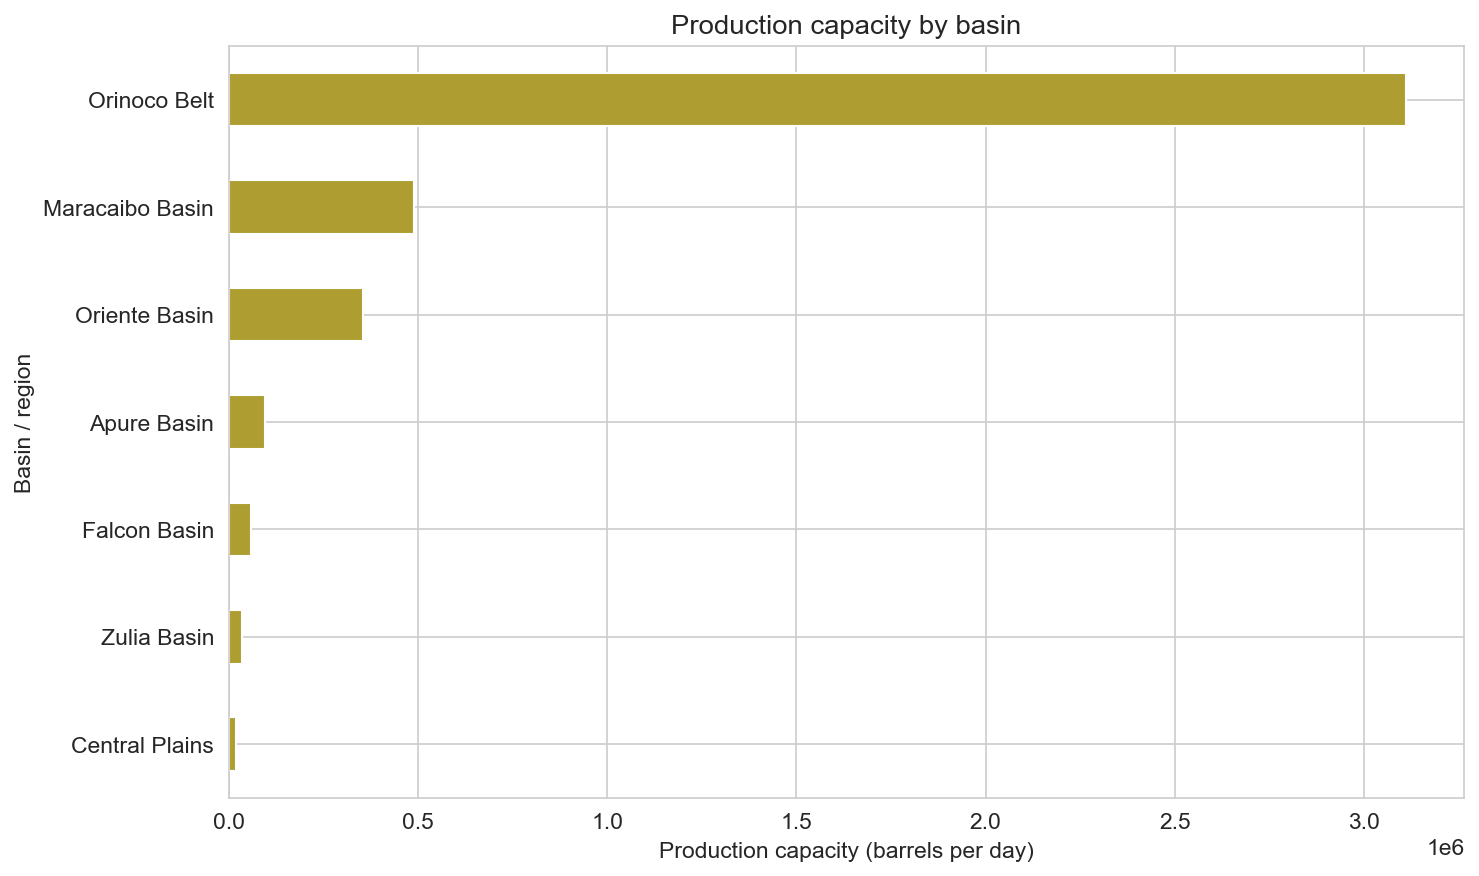
Reserves and production capacity are heavily concentrated in a few basins. The Orinoco Belt dominates on both proven and recoverable reserves, thanks to the aggregate size of the belt and the many individual projects (Carabobo, Junin, Machete, Zuata, Hamaca, Cerro Negro, etc.) that sit within it. The Maracaibo Basin ranks second by proven reserves and is the historic heart of Venezuelan production, with Lake Maracaibo and surrounding fields. The Oriente Basin (eastern Venezuela), Barinas-Apure, Zulia, Falcon, and Central Plains (e.g. Guarico) hold smaller but still significant reserves and capacity.
The next three charts show proven reserves, recoverable reserves, and production capacity by basin. The Orinoco Belt’s share of proven reserves is so large that other basins appear as a long tail—a reflection of both geology and the way the dataset aggregates the belt.
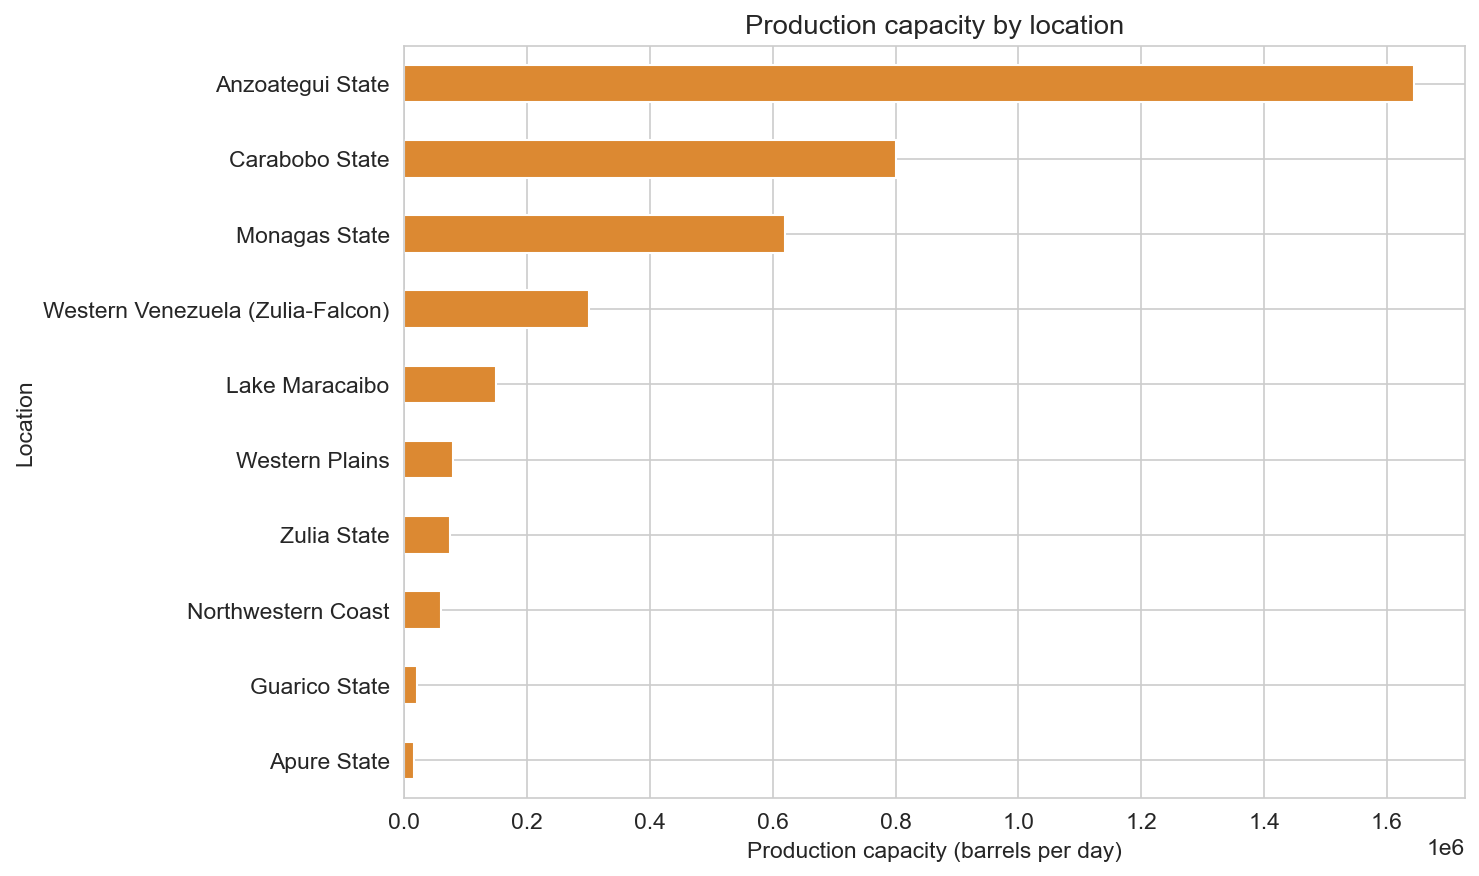
Production capacity by location (state or area) highlights eastern Venezuela (Anzoategui, Monagas, Carabobo), Lake Maracaibo, and the western plains. Coastal and southern locations (e.g. Punta Pescador, San Tomé) contribute smaller volumes. This geographic spread matches the known layout of Venezuelan oil: conventional light/medium in Maracaibo and Oriente, extra-heavy in the Orinoco, and scattered conventional fields elsewhere.
What kind of oil: grades and types
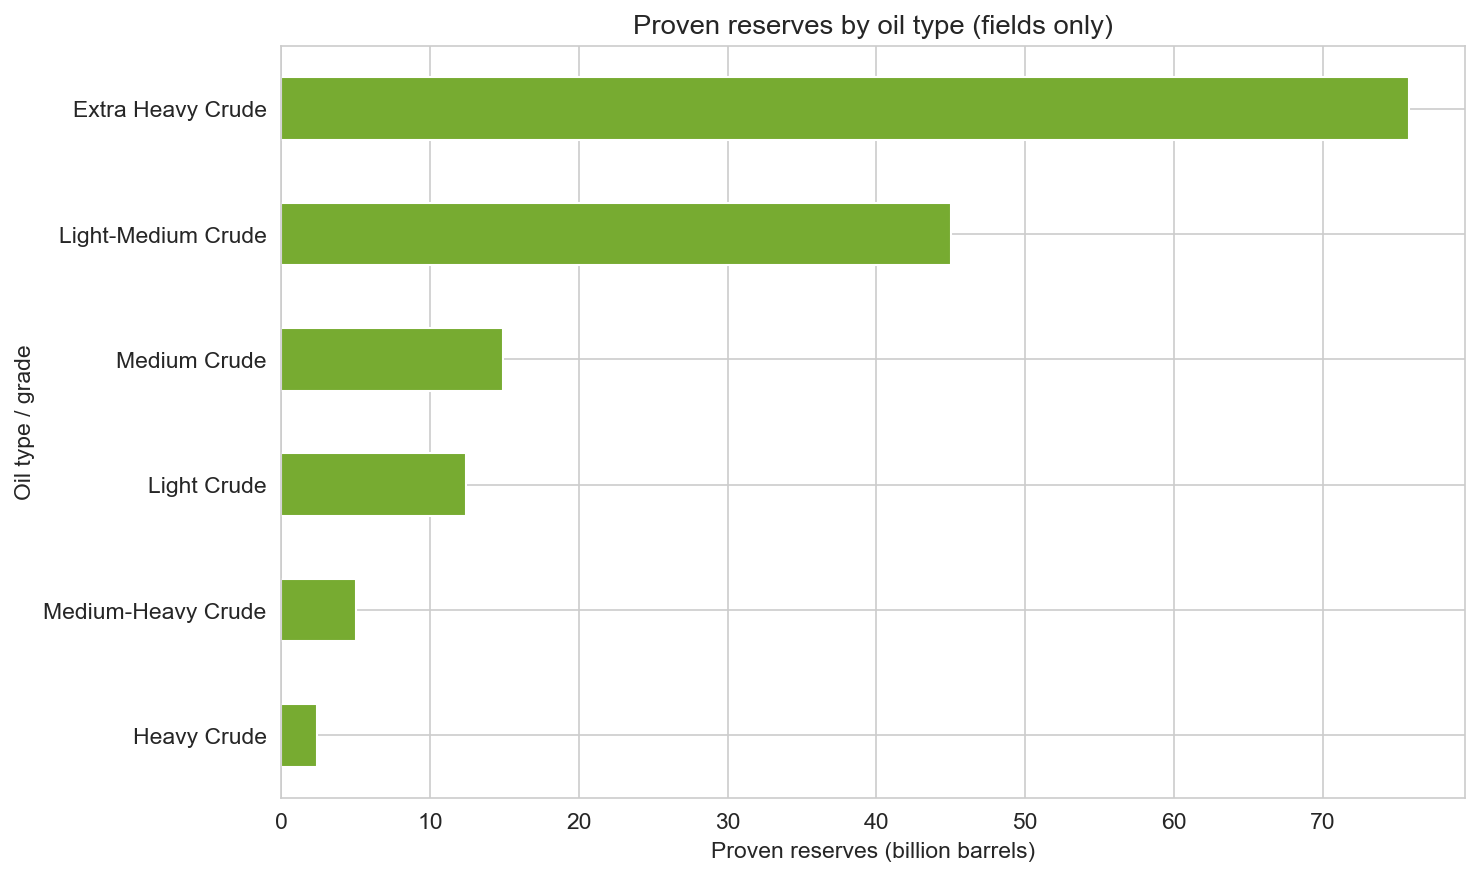
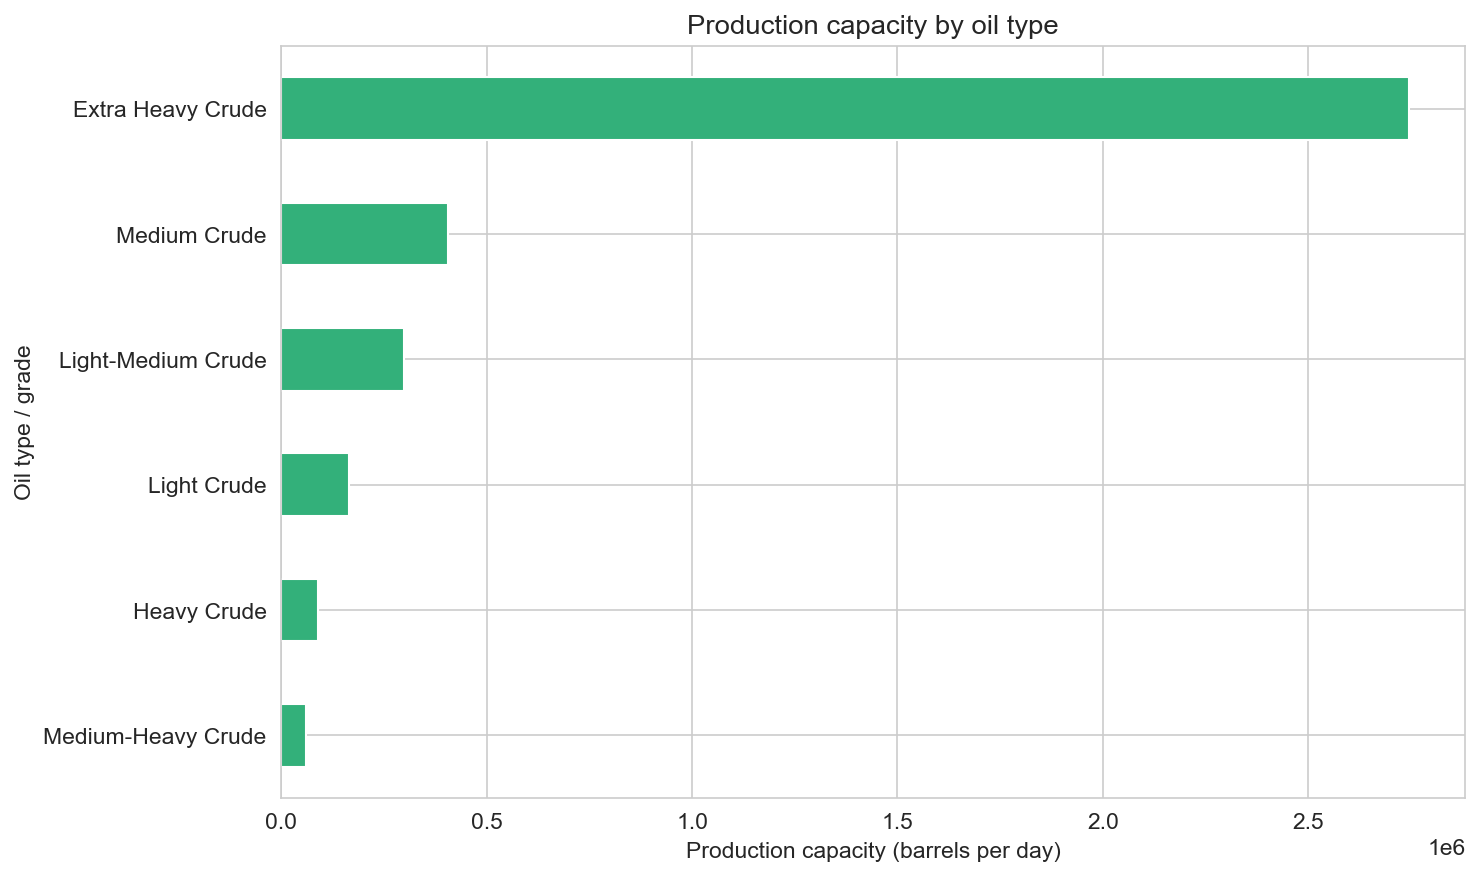
Venezuela’s resource base is dominated by extra-heavy crude, especially in the Orinoco Belt, where oil must often be upgraded or diluted for transport and refining. The dataset also includes light, medium, medium-heavy, and heavy crudes from Maracaibo, Oriente, Barinas-Apure, Falcon, and other basins.
The following charts show proven reserves and production capacity by oil type. Extra-heavy crude leads on both metrics; medium and light-medium crudes (from Maracaibo and parts of Oriente) account for a large share of the remainder. Heavy crude appears in a few mature or declining fields (e.g. Quiriquire, Tia Juana). This split underscores why the Orinoco is central to any discussion of Venezuelan oil: it is not only the largest reserve base but also the main source of extra-heavy production and upgrading projects.
Lifecycle: status of fields
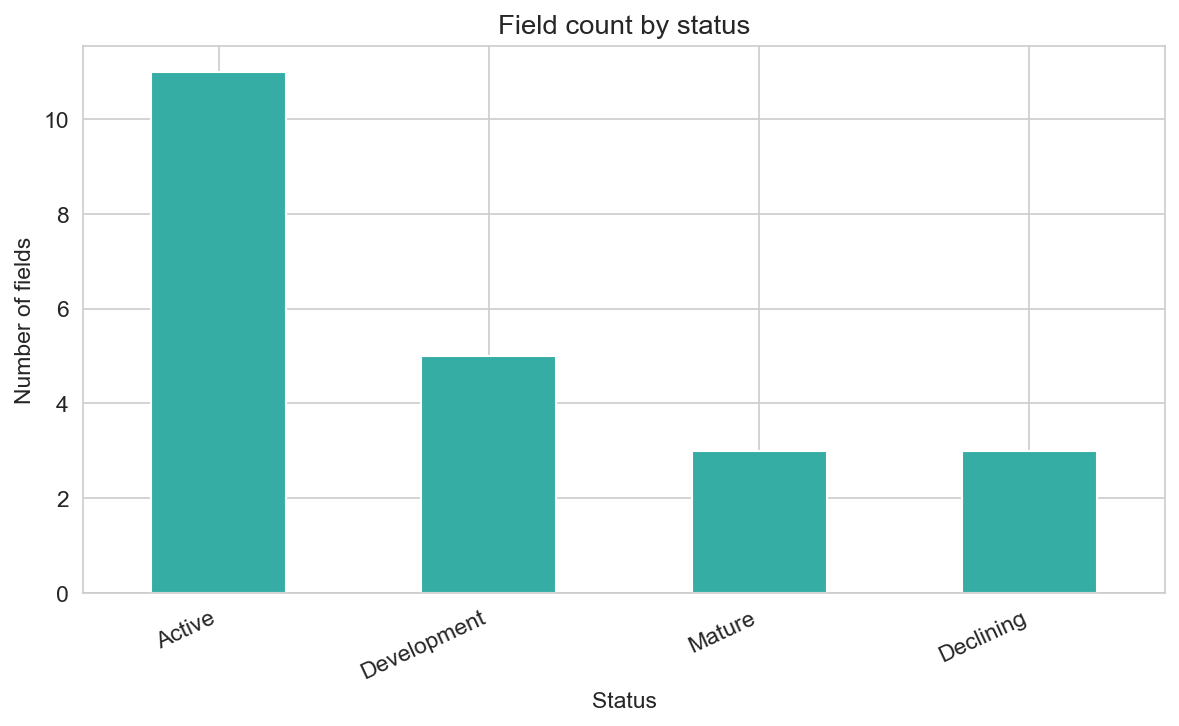
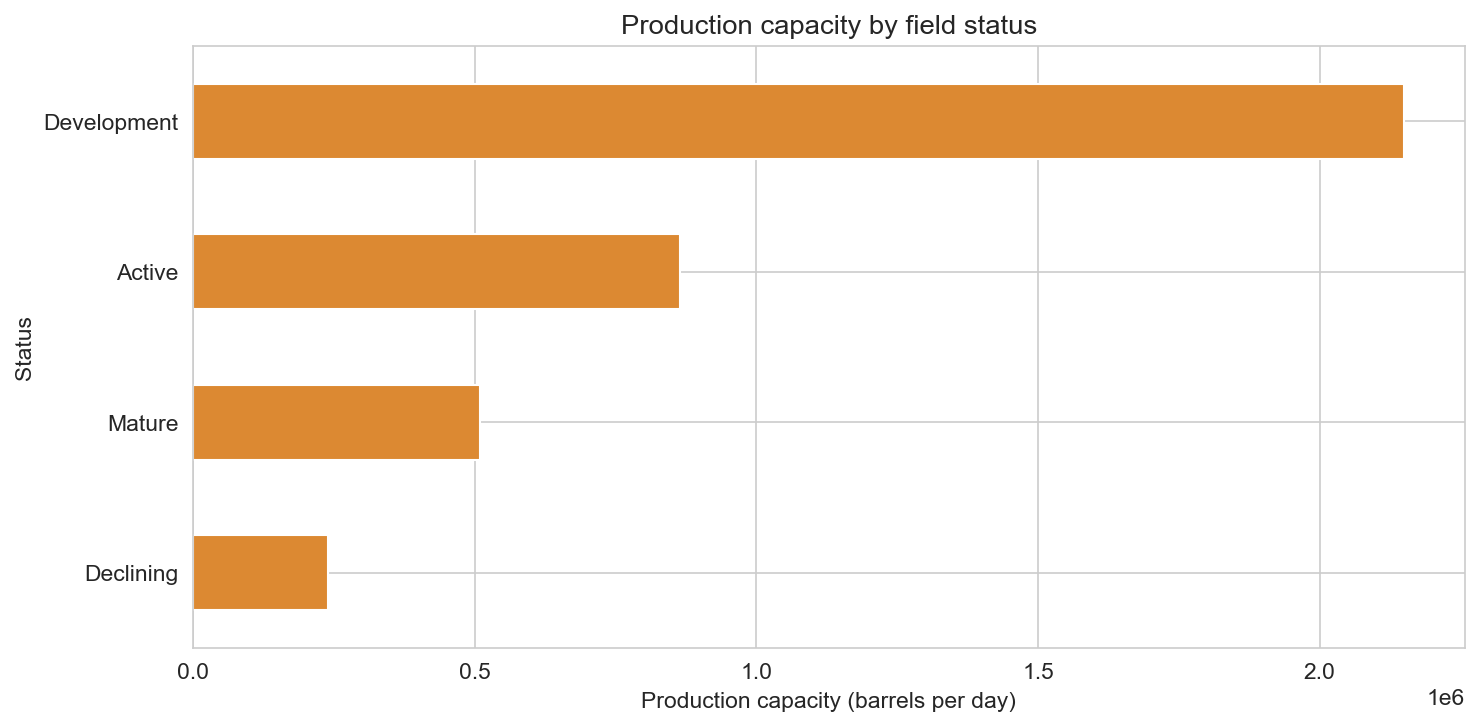
Fields in the dataset are classified as Active, Development, Mature, or Declining. Active fields are in current production; Development typically refers to Orinoco projects that are being expanded or brought on stream; Mature and Declining reflect aging assets, especially in Maracaibo and some Oriente fields.
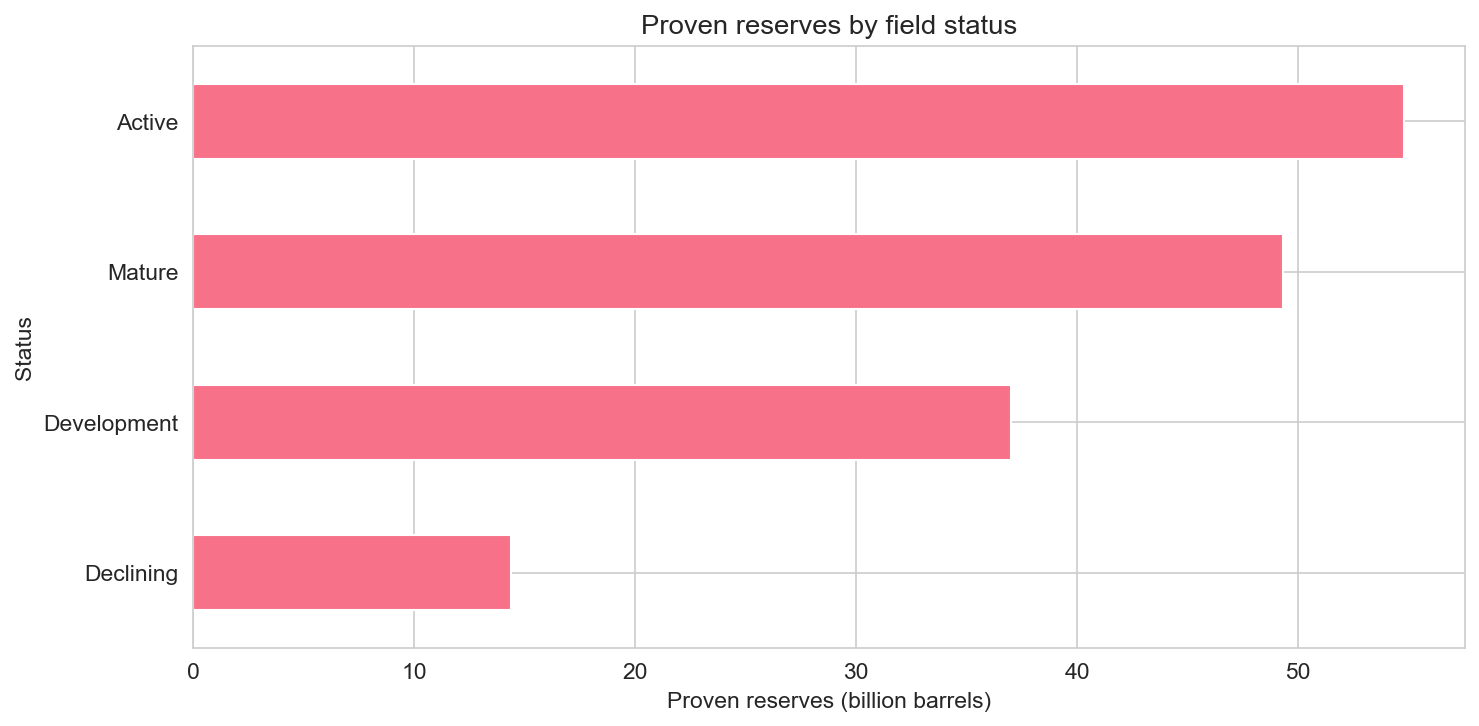
The count of fields by status shows a mix of active and development projects (many in the Orinoco) and a smaller number of mature or declining fields. When we aggregate reserves and production capacity by status, development and active dominate—consistent with the idea that much of Venezuela’s remaining potential is in the Orinoco and in projects that are not yet fully producing at nameplate capacity. Declining and mature fields still hold substantial reserves and capacity on paper, but real output is often constrained by infrastructure and investment.
Who operates what
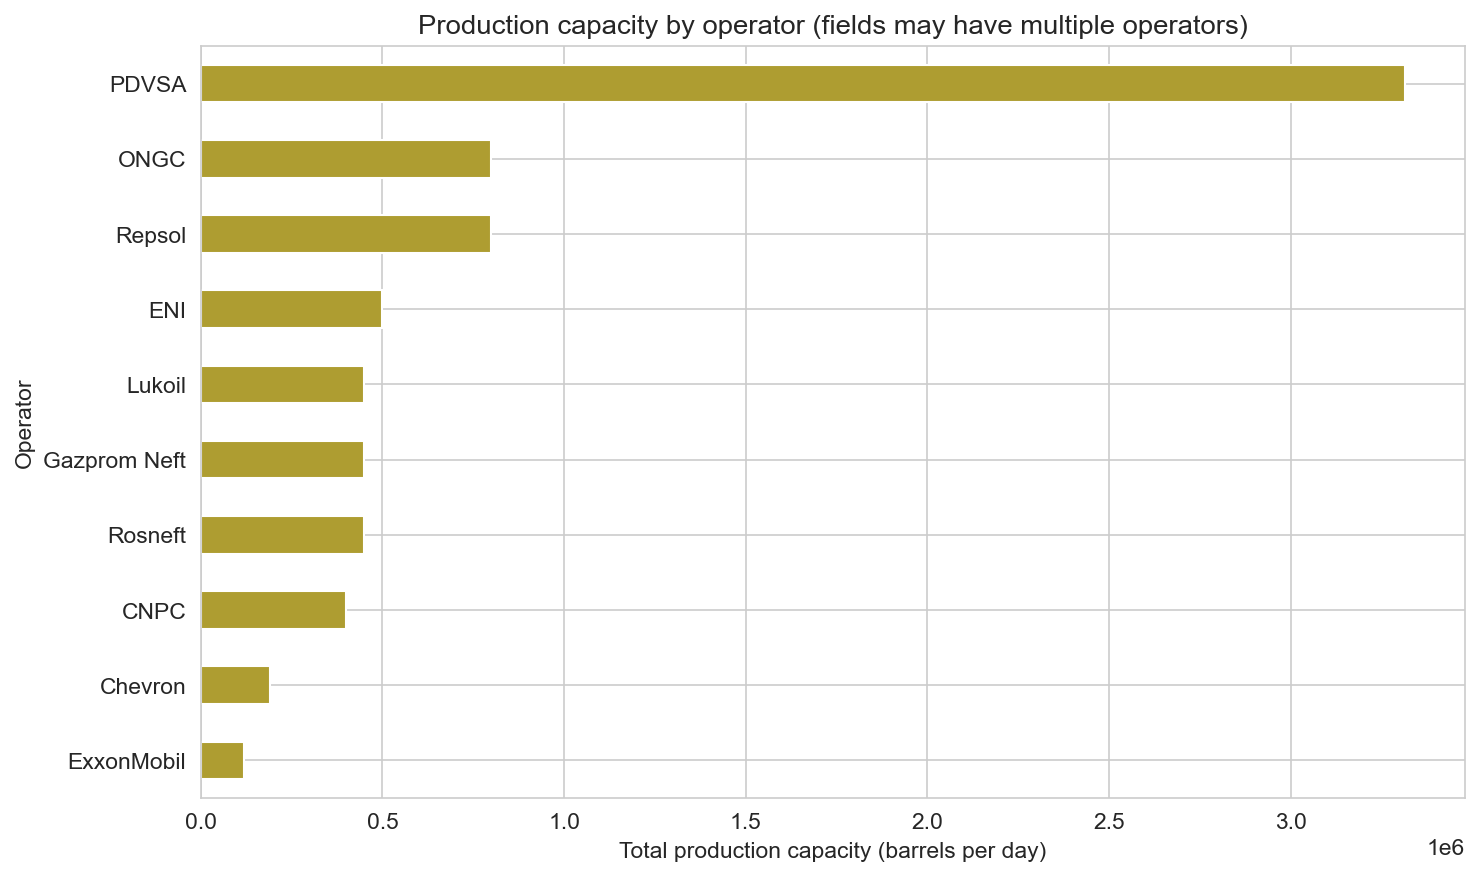
PDVSA (Petróleos de Venezuela) appears in almost every row, alone or with partners. International operators include Rosneft, CNPC, Repsol, ONGC, ENI, Chevron, ExxonMobil (noted in the data as having withdrawn from Cerro Negro in 2007), Gazprom Neft, and Lukoil. The dataset’s operator field often lists multiple names (e.g. PDVSA-Rosneft-CNPC); for the chart below we split these and attribute each field’s production capacity to every operator listed, so a single field can contribute to several operators’ totals.
Under that convention, PDVSA’s attributed capacity is the largest, reflecting its presence across almost all assets. Russian and Chinese partners show significant attributed capacity through Orinoco and other joint ventures. The mix of operators illustrates both the historical role of international oil companies and the current reliance on a smaller set of partners under sanctions and political constraints.
When it was found: discovery timeline
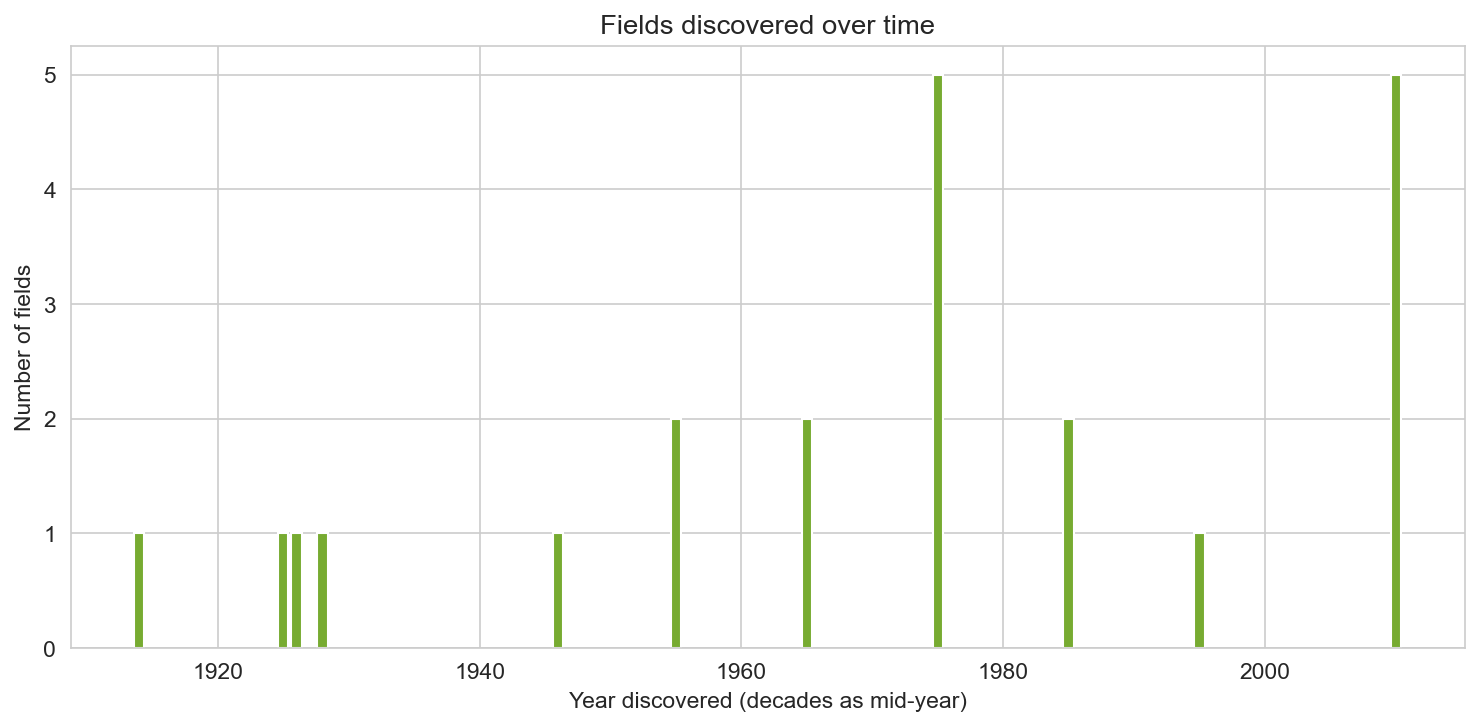
Discovery years in the dataset range from 1914 (Maracaibo Basin) through 2010 (several Orinoco blocks). Many entries use decade-level precision (e.g. 1920s, 1970s); in our charts we map those to a mid-decade year (e.g. 1970s → 1975) so we can plot a timeline.
The result shows a classic pattern: early discoveries in the 1920s–1960s (Maracaibo, Quiriquire, Tia Juana, Barinas-Apure, Falcon, San Tomé, Dacion, Guarico), a wave in the 1970s–1980s (Orinoco areas like Machete and Zuata, Oriente fields such as El Furrial and Musipan, Cerro Negro, Punta Pescador), and another cluster in the 1990s–2010 (Hamaca, Orinoco total, and the Carabobo and Junin blocks). So the portfolio is a mix of very old, mature assets and newer Orinoco projects that define the country’s long-term potential but remain sensitive to investment and geopolitics.
Key assets: top fields by reserves and capacity
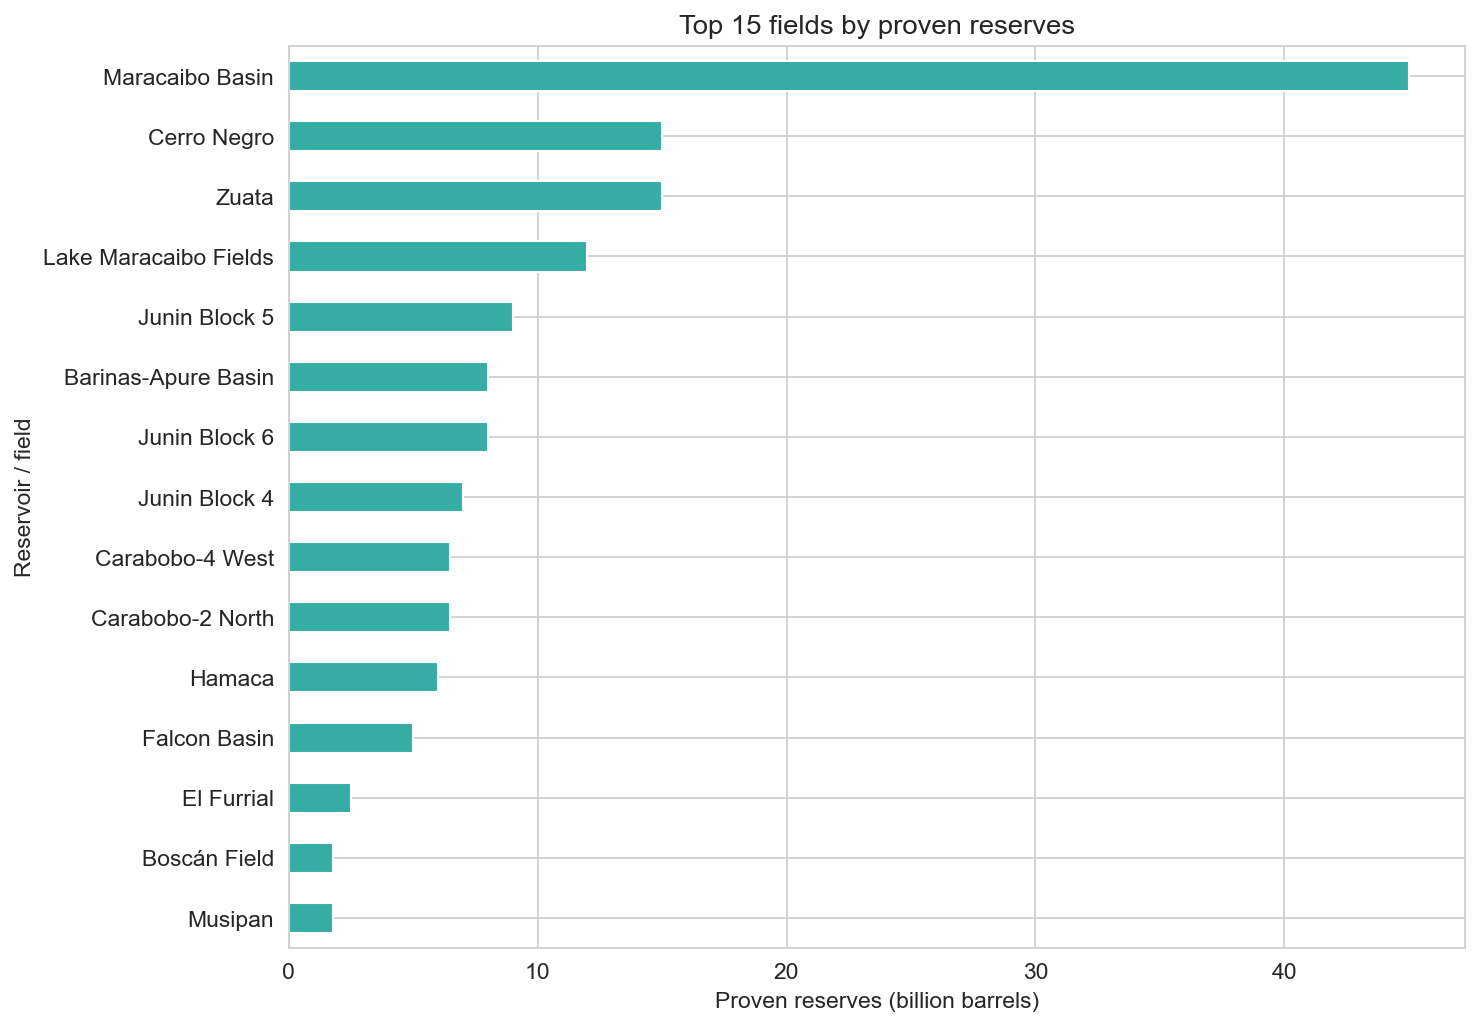
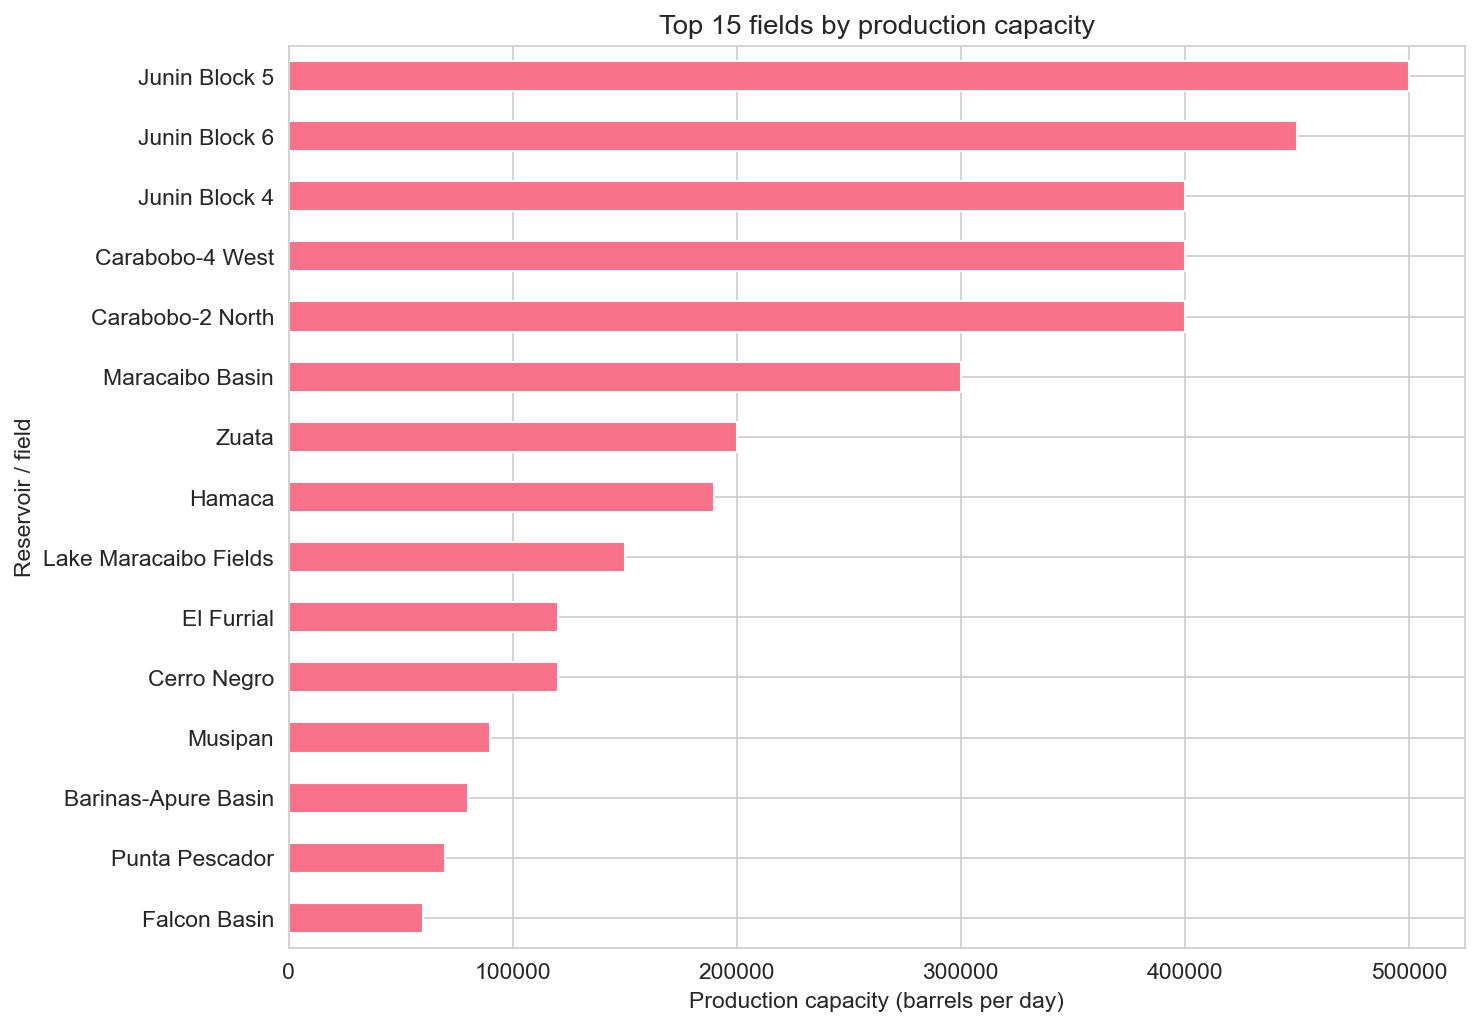
Which specific fields and projects drive the totals? The next two charts show the top 15 by proven reserves and the top 15 by production capacity (again excluding the Orinoco Belt aggregate row).
By reserves, the largest individual entries include Maracaibo Basin and Lake Maracaibo Fields, the Orinoco projects Zuata, Cerro Negro, Junin Block 5/6/4, and Carabobo-2 North / Carabobo-4 West, plus Barinas-Apure and Falcon. By capacity, the Junin and Carabobo blocks, Zuata, Hamaca, and Maracaibo/Lake Maracaibo lead. The overlap between “most reserves” and “most capacity” is only partial: some high-reserve areas have modest current capacity (e.g. development projects not yet at full output), while some smaller reserves support significant capacity (e.g. mature Oriente fields). The scatter plot in the next section makes that relationship explicit.
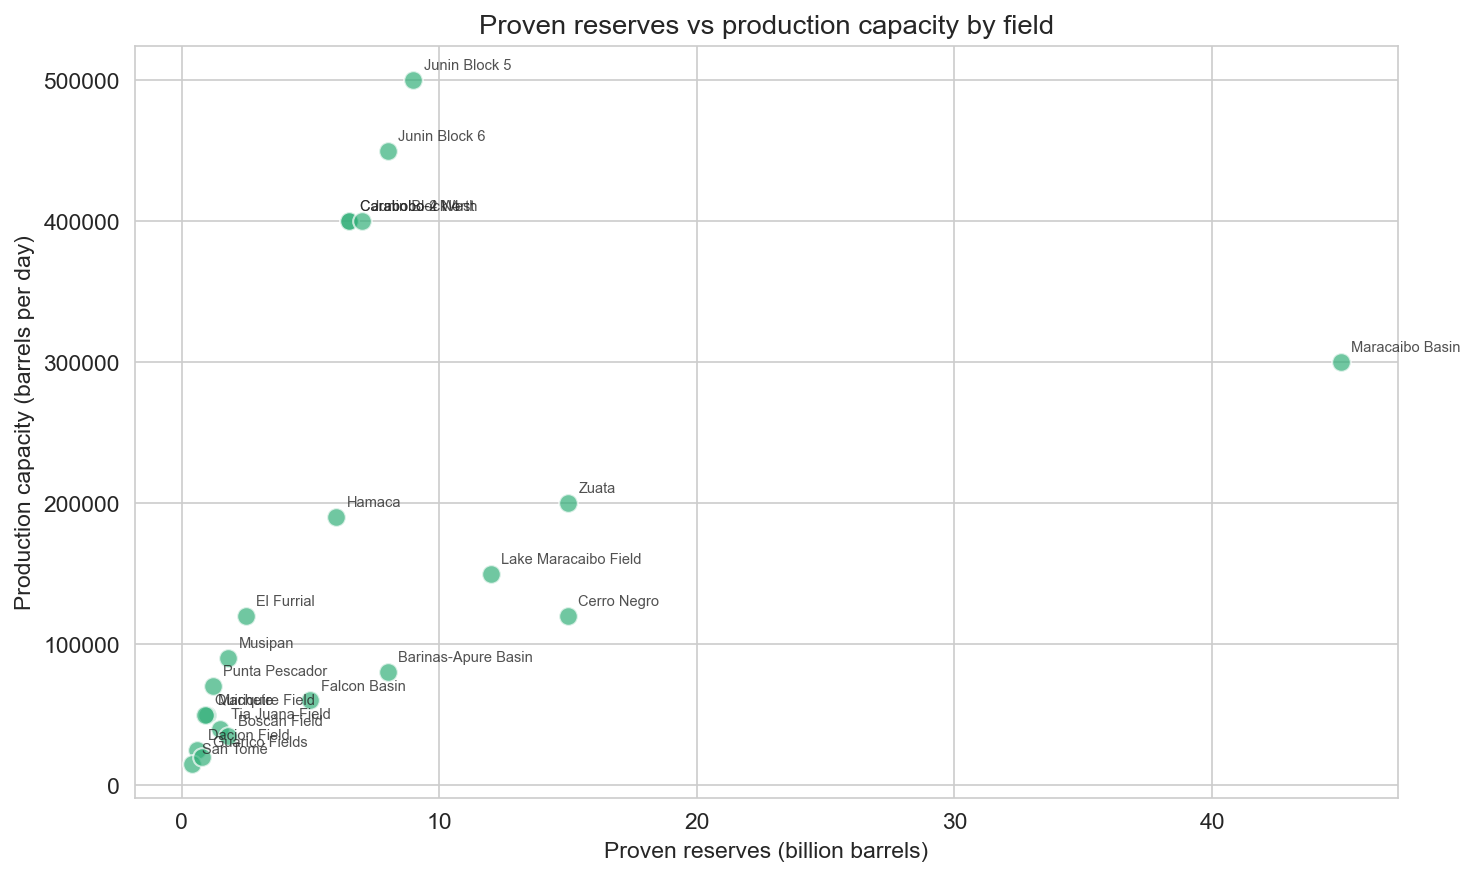
Reserves vs capacity
The scatter plot of proven reserves (billion barrels) vs production capacity (barrels per day) by field reveals how reserve size and current capacity are related. Some points sit in the “high reserves, high capacity” quadrant (e.g. Maracaibo Basin, Zuata); others have high reserves but more modest capacity (e.g. Orinoco development blocks); and some have relatively high capacity for their reserve base (e.g. certain Oriente fields). Outliers and spread reflect different vintages, development stages, and technical constraints (e.g. extra-heavy vs light crude). The plot is a useful sanity check: reserves alone do not determine current capacity; investment, geology, and infrastructure do.
Conclusion
Venezuela’s oil landscape in this 2026 dataset is dominated by geography (Orinoco and Maracaibo), oil type (extra-heavy in the Orinoco, light/medium in Maracaibo and Oriente), and lifecycle (mix of active, development, mature, and declining). PDVSA is the constant; international partners appear mainly in Orinoco and a few other projects. Discovery timing spans a century, from 1914 to 2010, with older fields in Maracaibo and Oriente and newer ones in the Orinoco. Top assets by reserves and capacity are a mix of basin-level entries and named projects; the relationship between reserves and capacity varies by field and status.
Limitations of the analysis: the dataset has 23 rows and one aggregate; it does not include every field or block in Venezuela. Reserves and capacity are as reported in the source and may not reflect real-time production or the impact of sanctions and underinvestment. Estimated recoverable reserves use midpoint values where the source gives a range. Nevertheless, the picture is consistent with widely reported facts: Venezuela has enormous reserves, especially in the Orinoco, but realizing that potential depends on investment, technology, and geopolitical conditions that go beyond this dataset.
Data and methodology
The analysis is based on the Venezuela Oil Reservoirs and Fields 2026 dataset (Kaggle: mjawad17/venezuela-oil-reservoirs-and-fields-2026): 23 rows (22 fields plus one Orinoco Belt total) with columns for reservoir name, basin/region, location, proven reserves (billion barrels), estimated recoverable reserves (billion barrels), production capacity (barrels per day), oil type/grade, status, major operators, year discovered, and notes.
Data cleaning: Proven reserves and production capacity were parsed as numeric values. Estimated recoverable reserves that were given as ranges (e.g. 100–270) were converted to the midpoint for aggregation. Year discovered was parsed from exact years (e.g. 1914, 2010) and decades (e.g. 1970s → 1975) for timeline charts. The row "Orinoco Belt (Total)" was kept for basin-level charts but excluded from per-field charts (e.g. top fields by reserves, scatter plot) to avoid double-counting.
Figures: All charts were generated with pandas and seaborn from the cleaned CSV. They are saved under public/images/blog/venezuela-oil-reservoirs-2026/ and embedded in this post. Totals (e.g. 390.5 billion bbl proven, 4.165 million bbl/day capacity) are computed from the dataset as described and may differ from official or real-time figures.


