

How do customers order at Starbucks—by channel, time of day, and region—and what drives how much they spend and how satisfied they are? This post uses the Starbucks Customer Ordering Patterns dataset by likithagedipudi on Kaggle: roughly 100,000 orders with customer and store attributes, order channel, cart size, drink category, fulfillment time, and satisfaction. We explore the distribution of spend, what’s in the cart, what people drink, how and where they order, who’s ordering (demographics, rewards, order-ahead), speed and satisfaction, and a Random Forest model of what drives total spend. The result is a data-backed snapshot of ordering behavior and levers that matter for both customers and operators.
The big picture
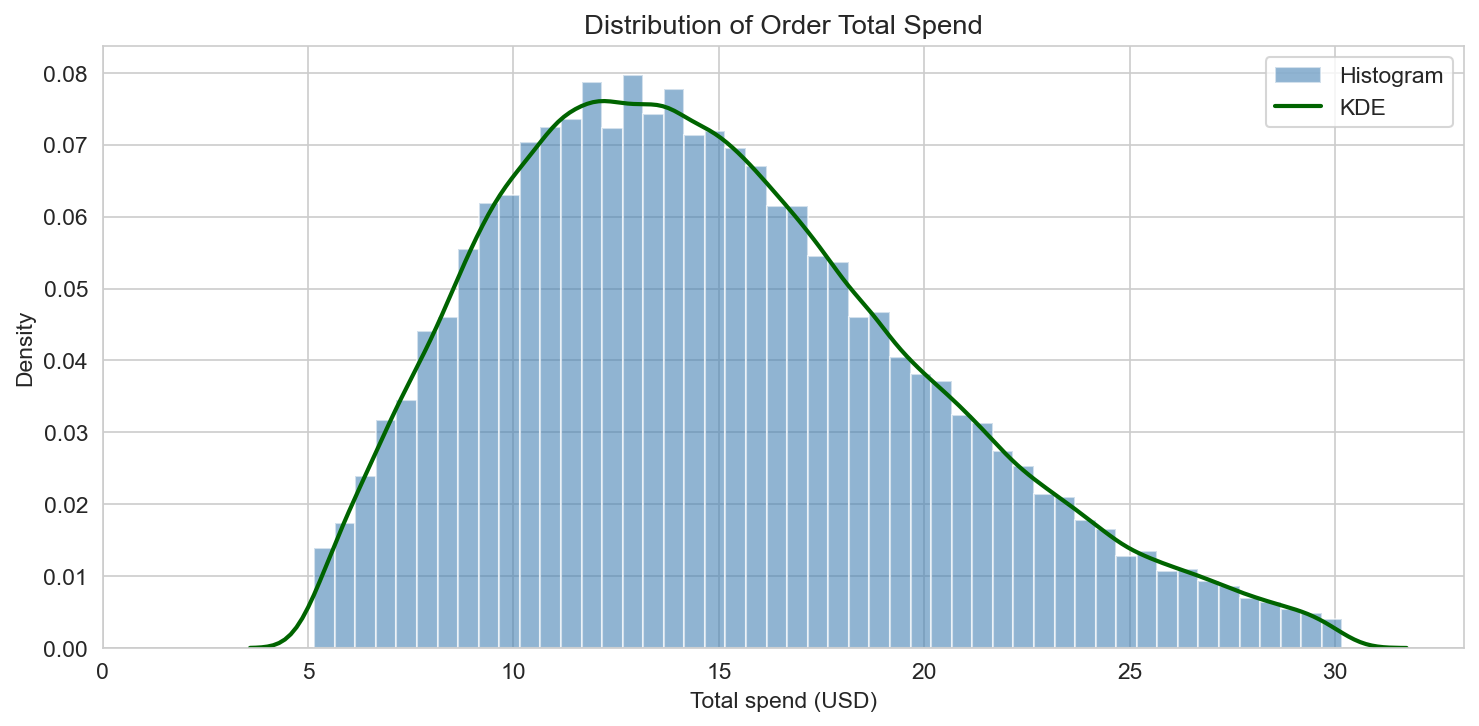
In the cleaned sample (about 96,000 orders after trimming extreme outliers), median order spend is $14.22 and the mean is about $14.83. The spend distribution is right-skewed: many orders sit in the $8–$20 band, with a long tail of higher baskets. Customer satisfaction (1–5 scale) has a median of 4 and a mean of about 3.69, so ratings lean positive but with meaningful variation.
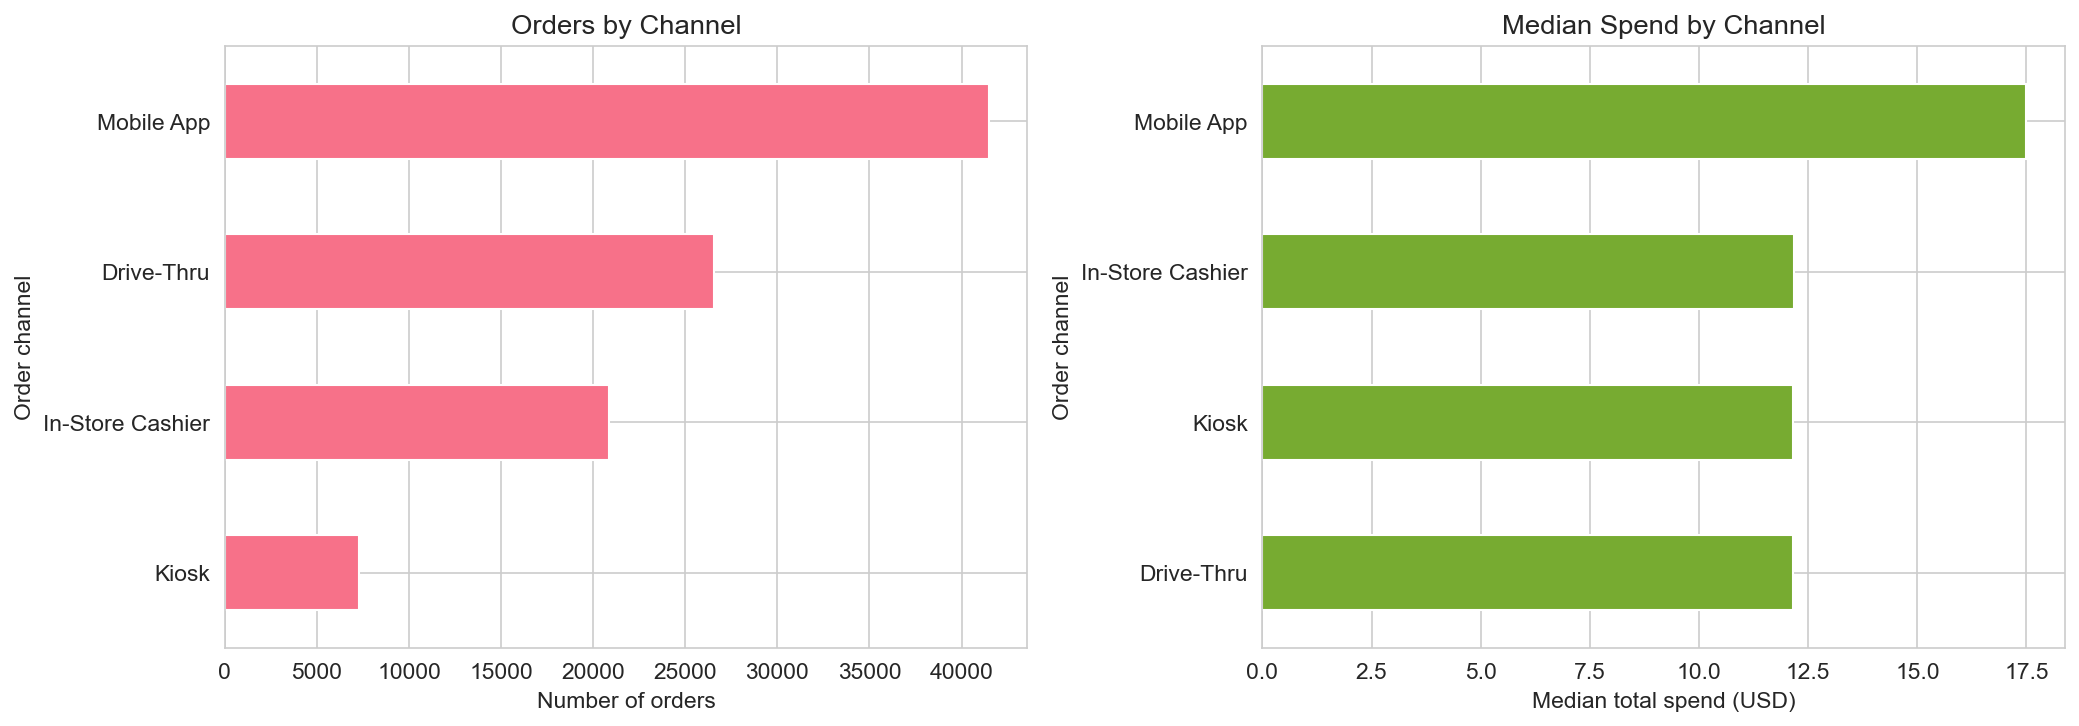
- Order channels: Mobile App dominates by volume, followed by Drive-Thru, In-Store Cashier, and Kiosk.
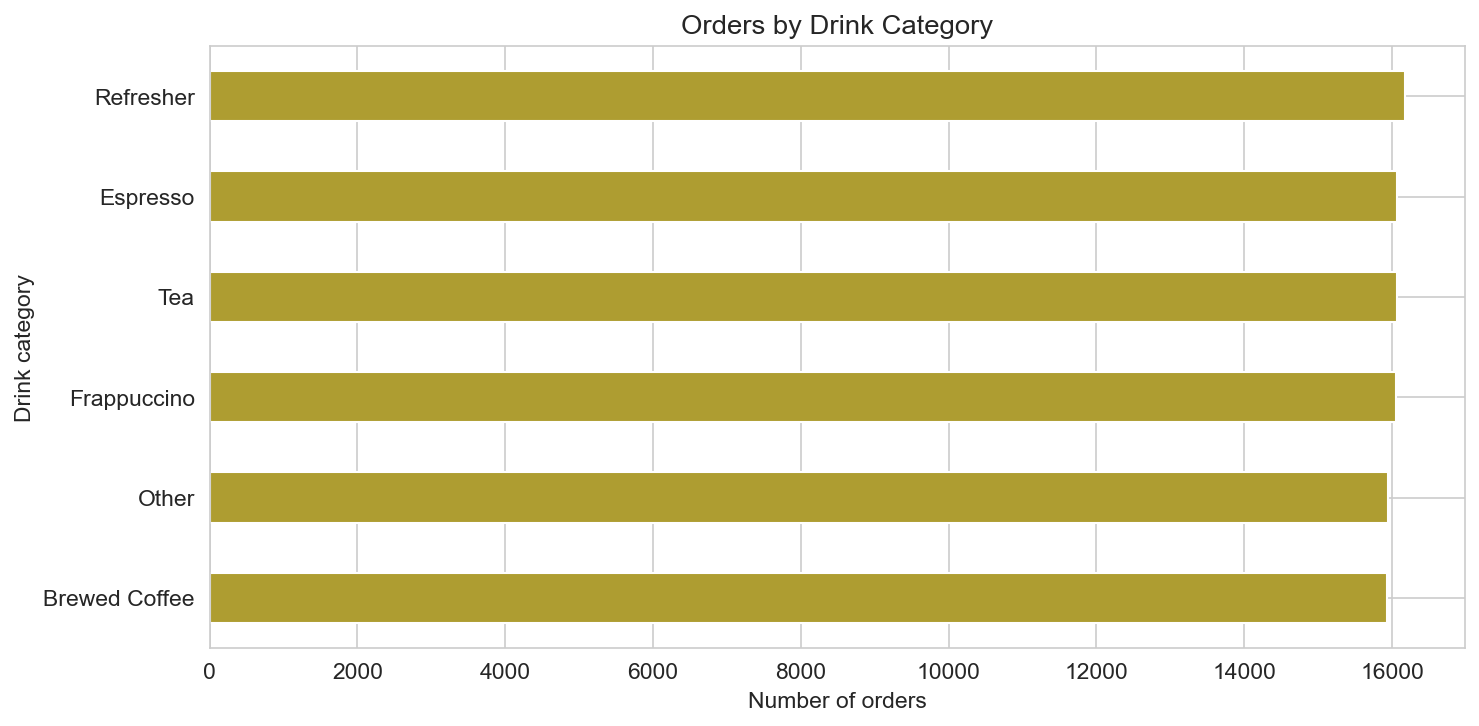
- Drink categories: Refreshers, Brewed Coffee, Frappuccino, Espresso, Tea, and Other all appear; Refreshers lead in order count in this sample.
- Data cleaning: We kept all rows with valid key fields and trimmed the top and bottom 1% of total spend and fulfillment time to reduce the impact of extreme outliers.
What’s in the cart
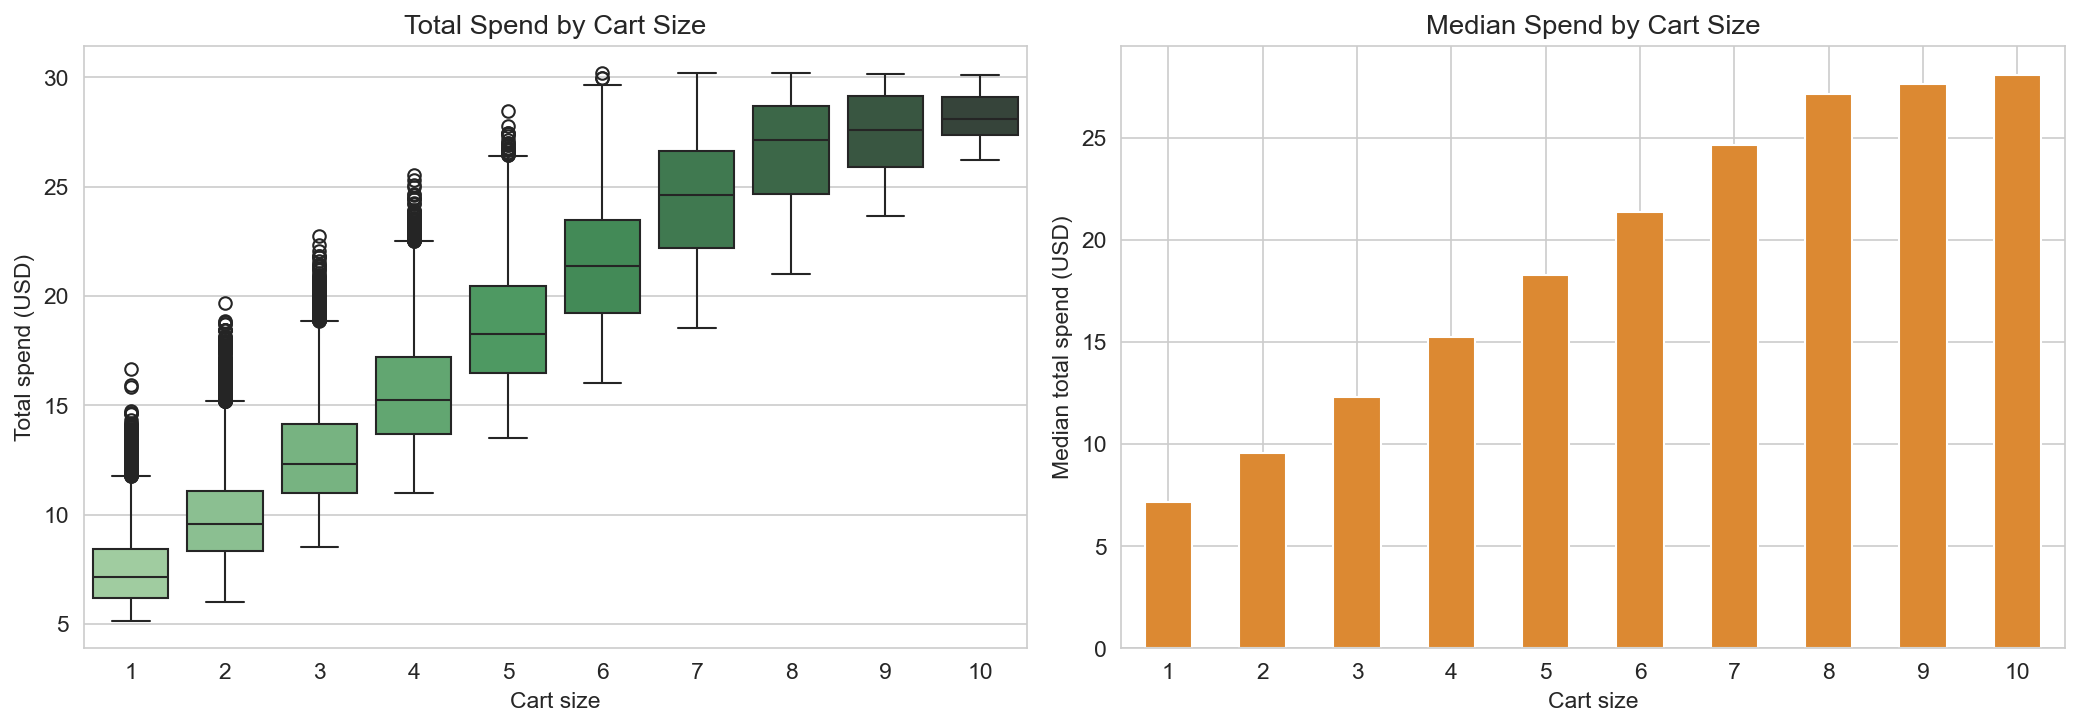
Cart size is a strong predictor of total spend: median spend rises with the number of items. The box plot and median-by-cart-size chart show a clear step-up as cart size increases. Customizations (e.g. extra shot, alternative milk) add variability; orders with more customizations tend to sit in the same or slightly higher spend bands. Food attachment matters too: about 32% of orders include at least one food item, and those orders have higher median spend than drinks-only orders. So basket size, customization, and food are all associated with higher check sizes.
What people drink
Drink category mix shows Refreshers leading in order count, followed by Brewed Coffee, Frappuccino, Espresso, Tea, and Other. The horizontal bar chart of orders by drink category reflects both beverage popularity and the mix of dayparts and customer segments in the sample. Median spend varies by category (e.g. multi-item or food pairings with certain drinks), but the main takeaway is a diverse mix: no single category dominates to the exclusion of others, and cold, hot, and espresso-based drinks all have substantial share.
How and where they order
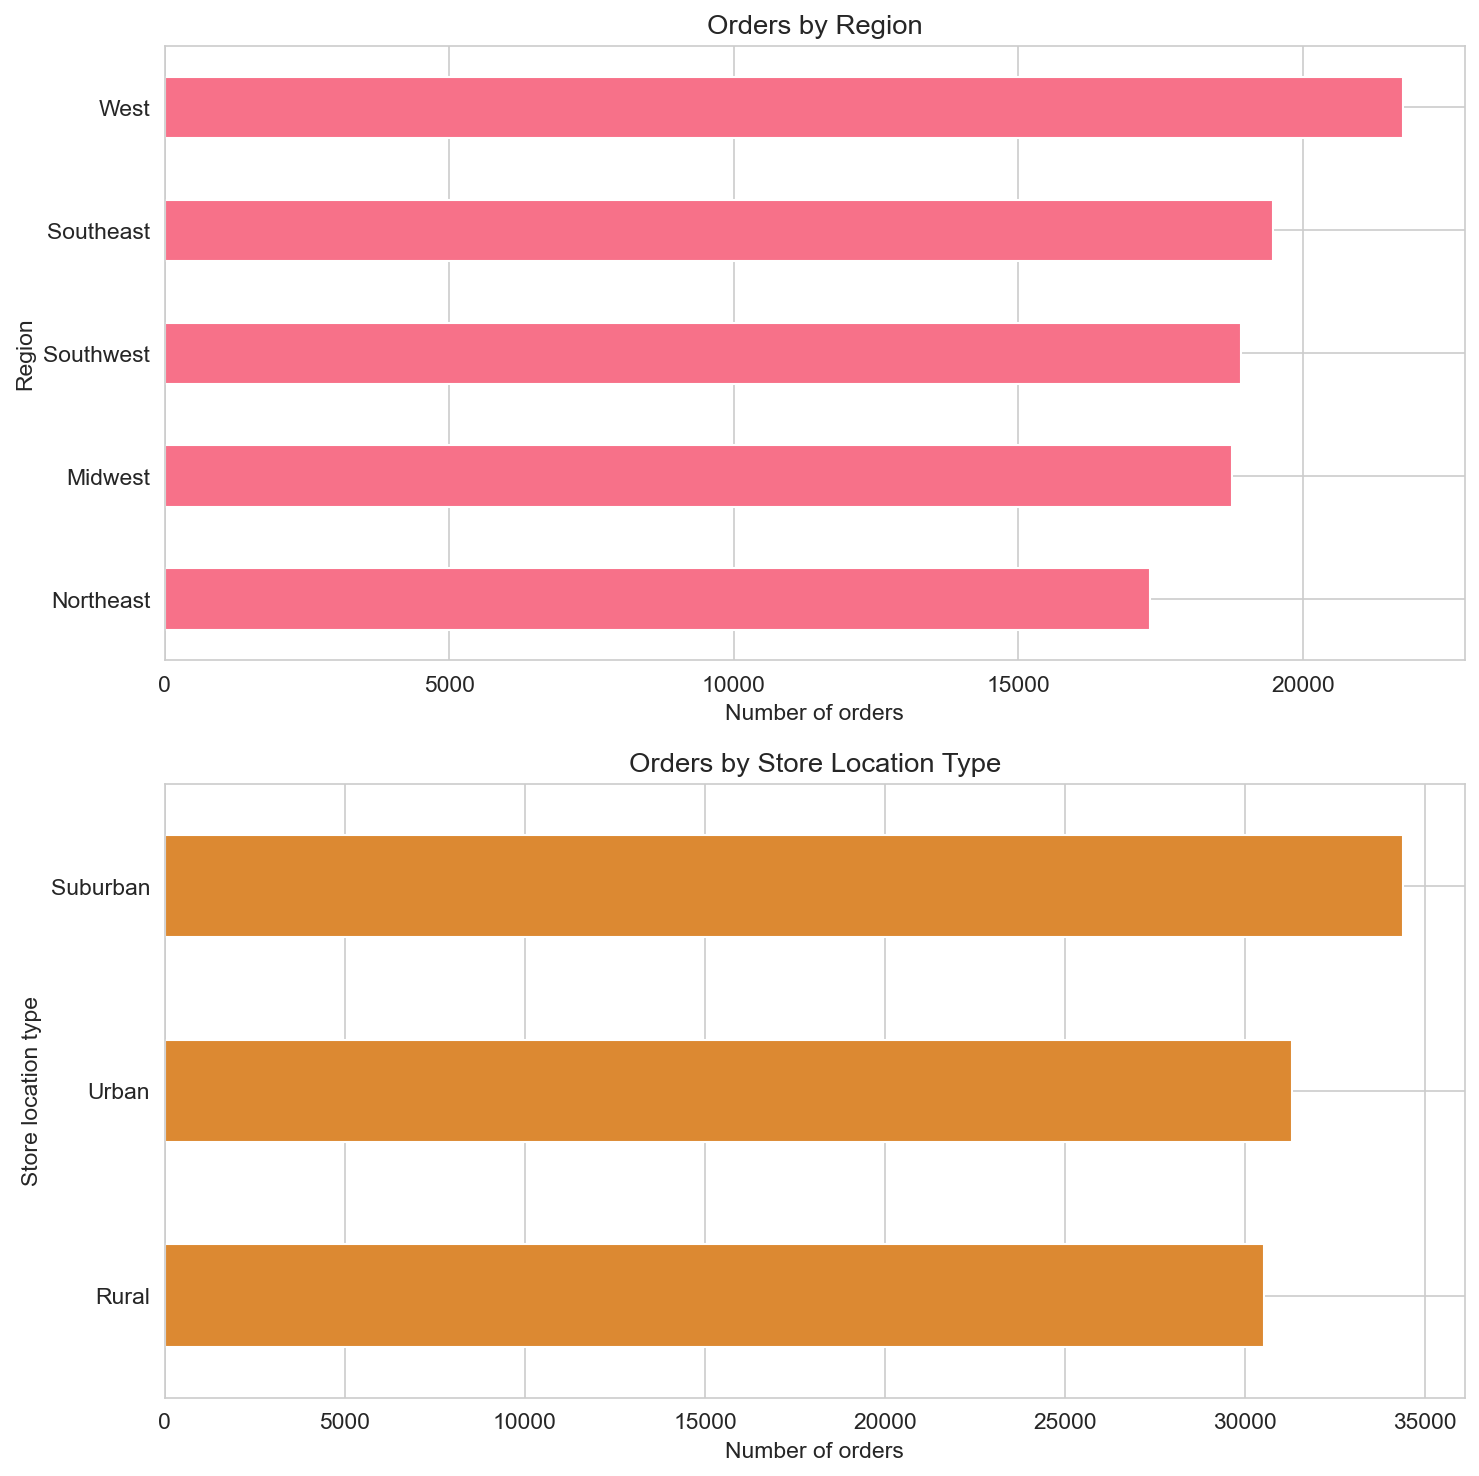
Order channel splits orders into Mobile App, Drive-Thru, In-Store Cashier, and Kiosk. The Mobile App accounts for the largest share of orders (about 41,000 in the cleaned sample), followed by Drive-Thru. Median spend differs by channel: app and kiosk orders tend to have slightly higher median spend than some in-person channels, consistent with larger or more customized baskets when ordering ahead or self-serving. Region and store location type (Urban, Suburban, Rural) show clear geographic spread: orders are distributed across regions, with Urban and Suburban stores contributing the bulk of volume. So “how” and “where” both matter for both volume and basket size.
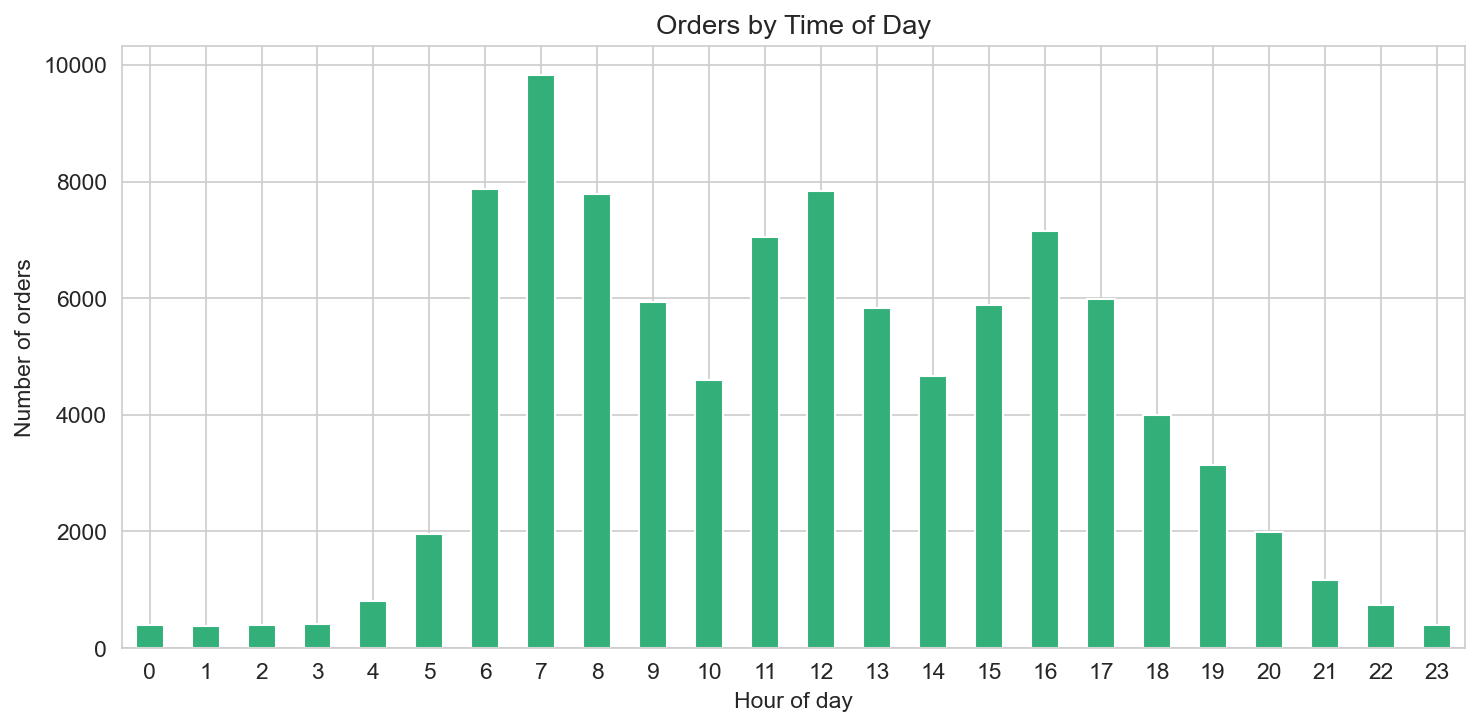
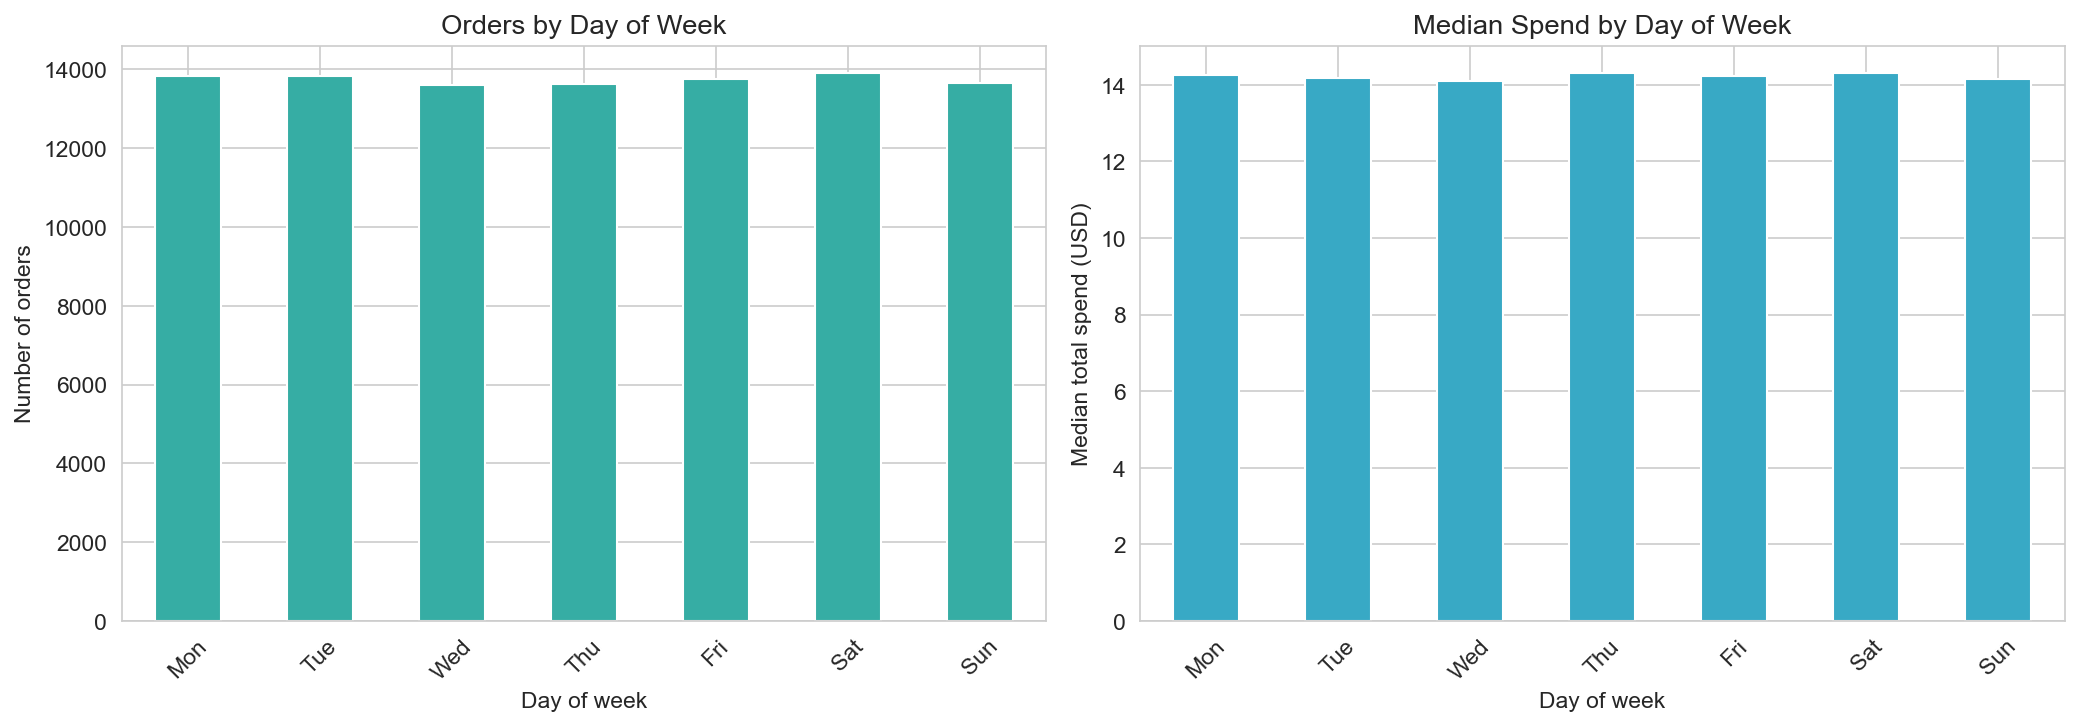
Time of day peaks in the morning (roughly 6–9 a.m.) and again in the mid-morning and lunch hours, with a long tail through afternoon and early evening. Day of week shows weekday versus weekend patterns: weekend days can show different order counts and median spend, reflecting leisure versus commute behavior. Together, these views describe when demand is highest and how basket size varies by time.
Who’s ordering
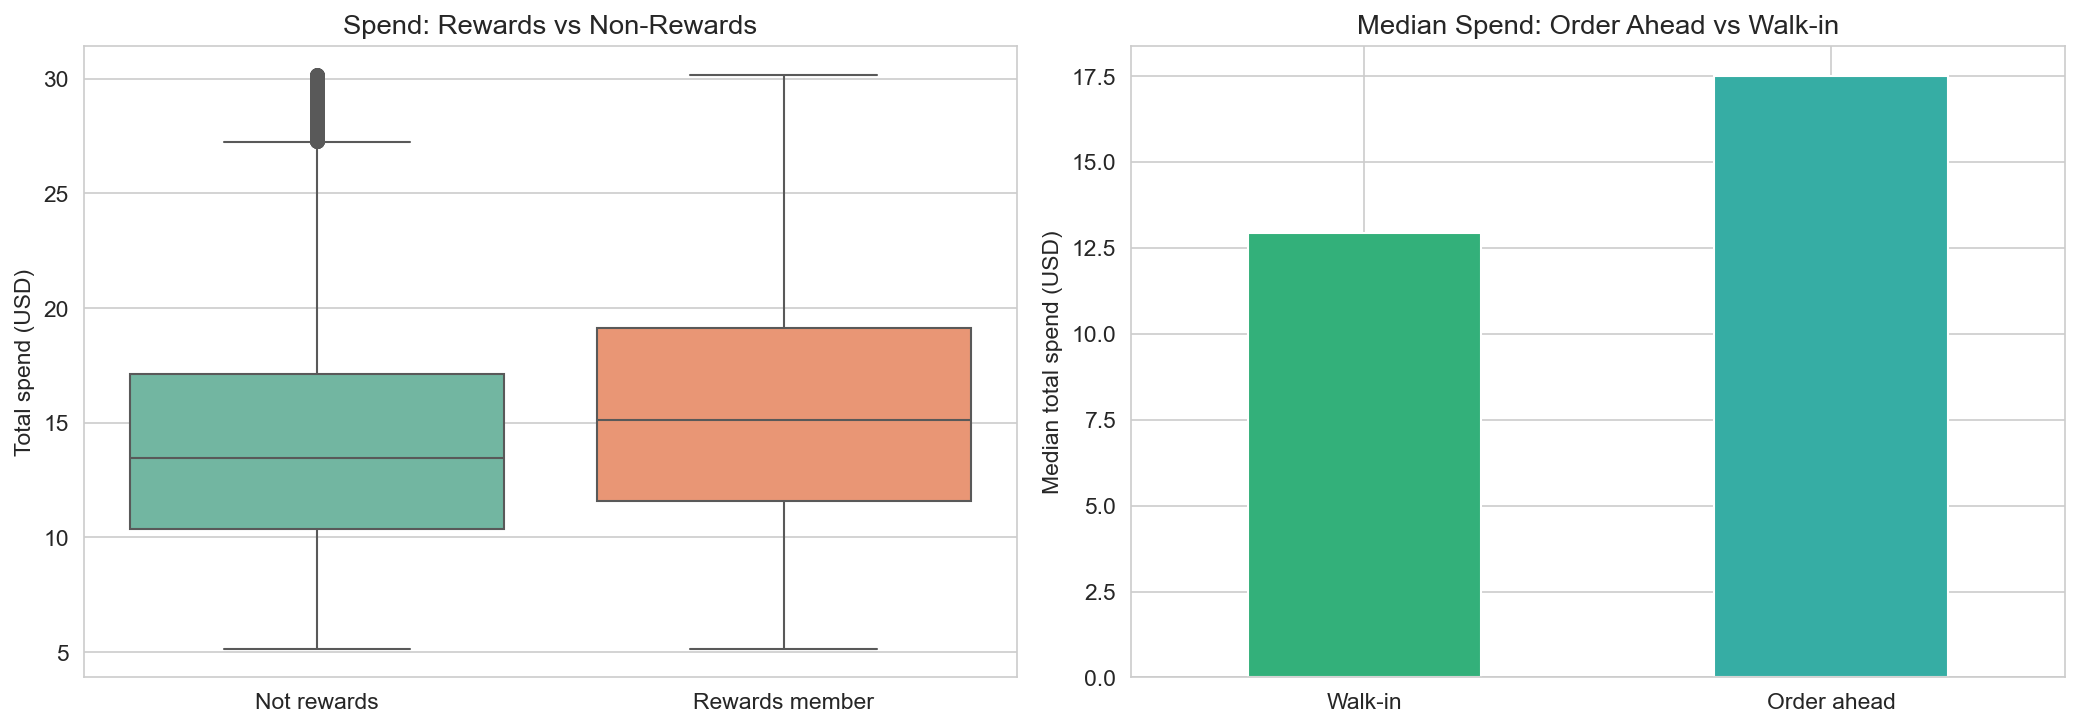
Age groups (18–24, 25–34, 35–44, 45–54, 55+) show different median spend levels; 25–34 and 35–44 often sit at or above the overall median, with younger and older segments showing their own patterns. Gender (and “Prefer not to say” / “Non-binary” where present) is represented across the sample; order counts by gender reflect the underlying customer base. Rewards membership is substantial: about 48% of orders in the sample are from rewards members. Rewards members tend to have higher median spend than non-members, consistent with more frequent or larger baskets among engaged customers. Order ahead (mobile or pre-order) accounts for about 30% of orders; order-ahead baskets also show higher median spend on average, aligning with planned or larger orders.
Speed and satisfaction
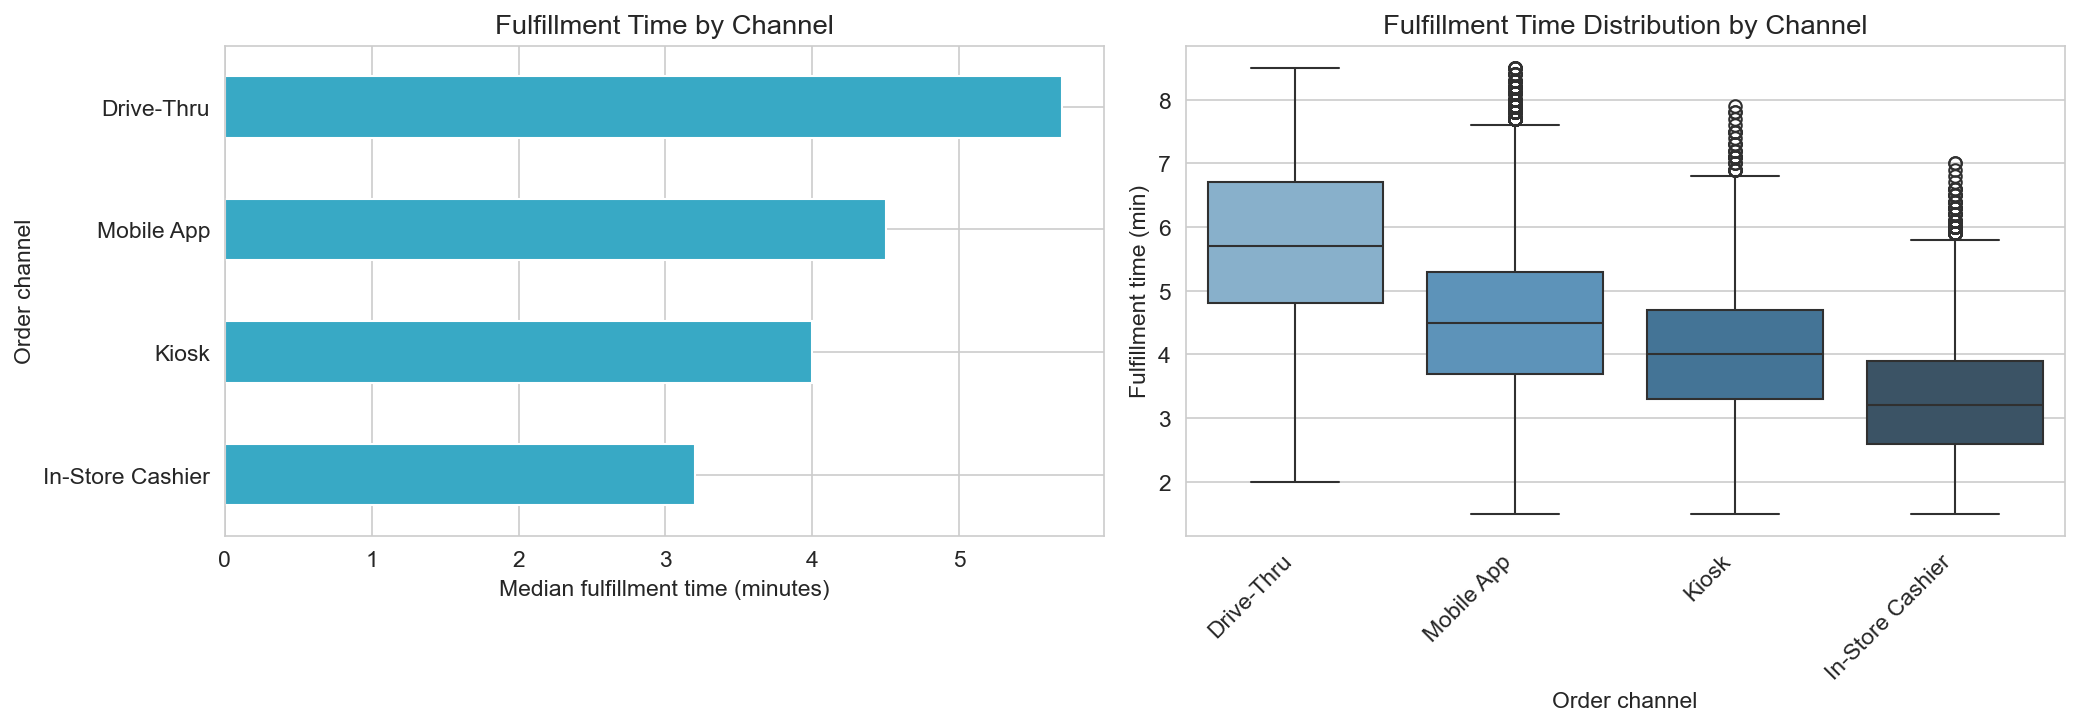
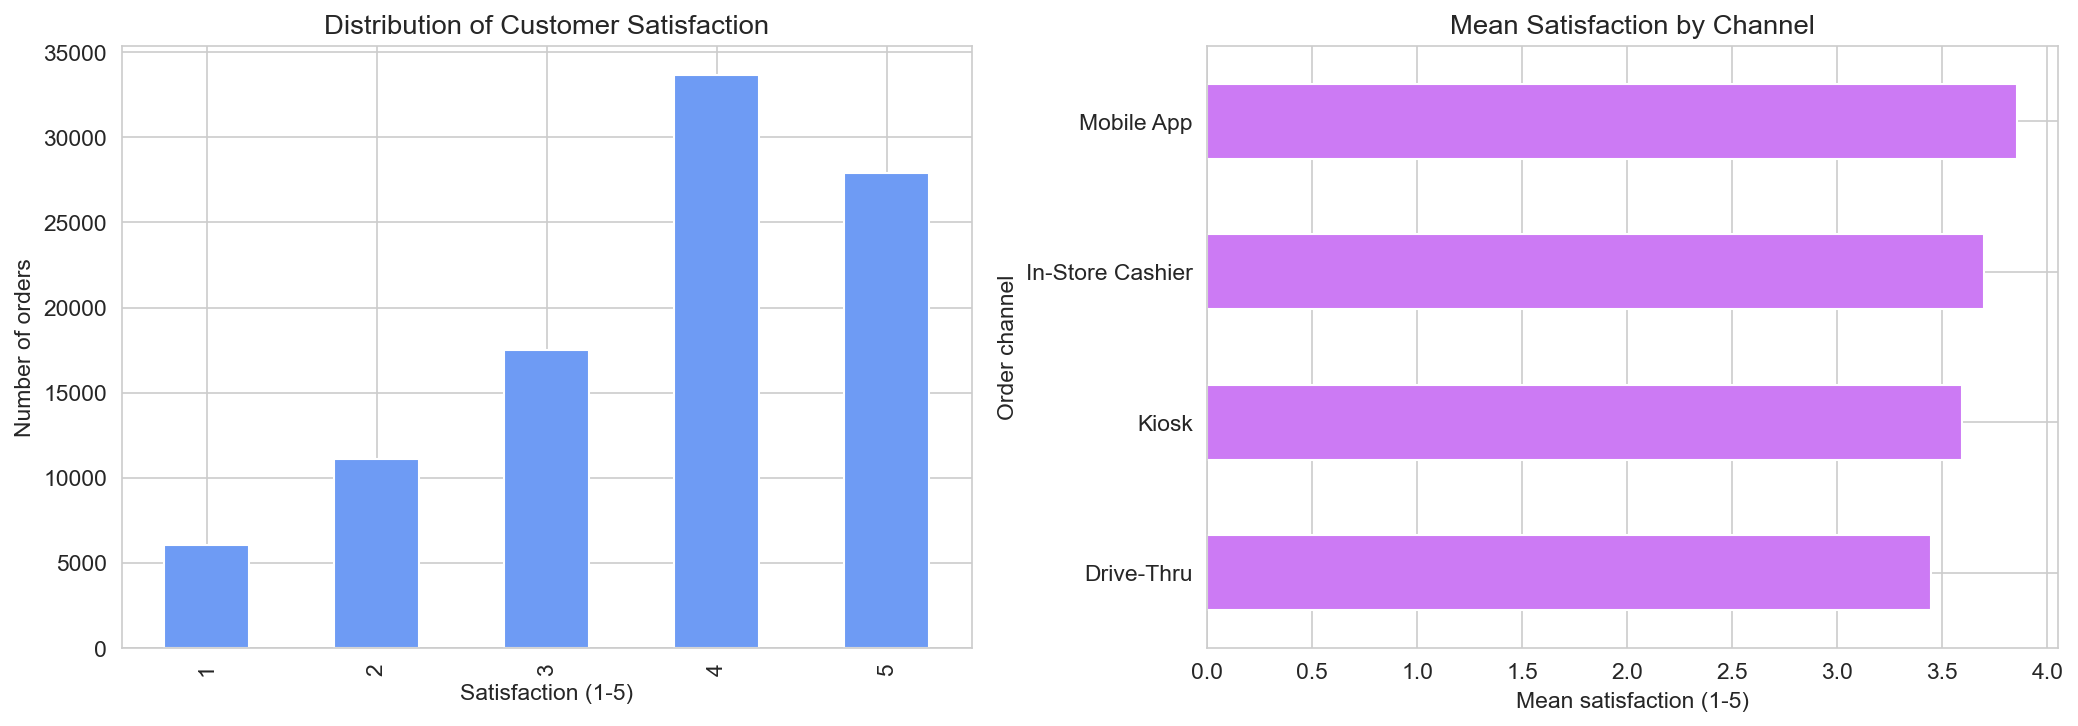
Fulfillment time (minutes from order to handoff) varies by order channel: Drive-Thru and In-Store can show different median times than Mobile App pickup or Kiosk, depending on store layout and queue management. The box plot of fulfillment time by channel highlights which channels are fastest on average and where variance is highest. Customer satisfaction (1–5) has a right-skewed distribution (many 4s and 5s). Mean satisfaction differs by channel: some channels (e.g. Mobile App, Kiosk) may show slightly higher mean satisfaction, possibly reflecting convenience or reduced wait perception. Fulfillment time and satisfaction are related: longer waits tend to associate with lower ratings, so speed and consistency matter for perceived quality.
Food attachment
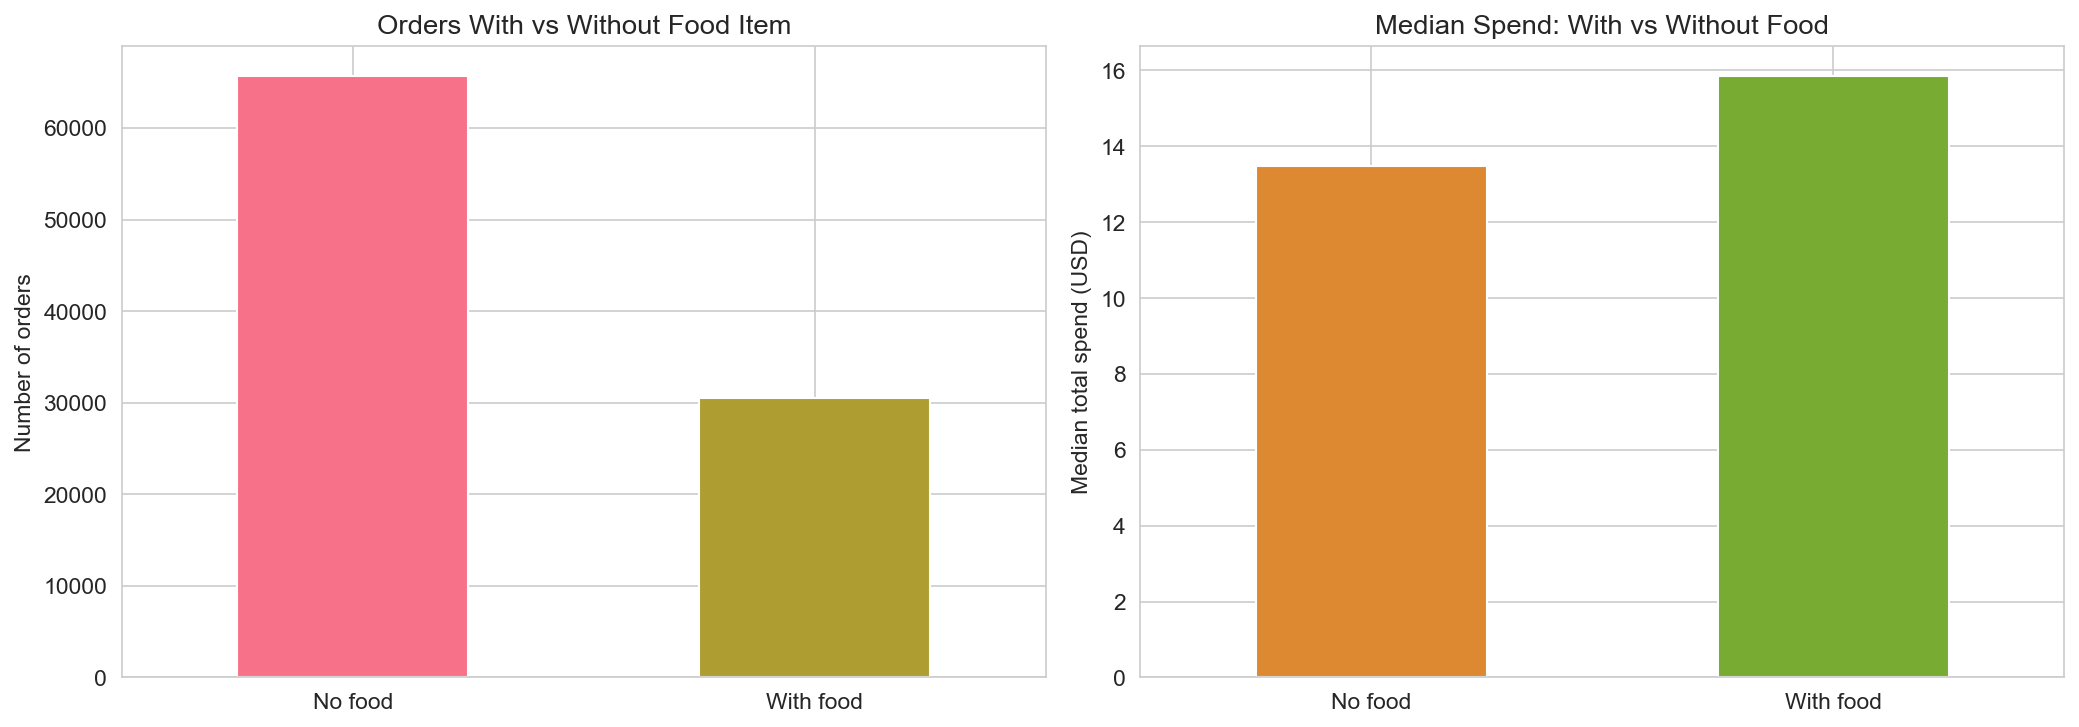
About 32% of orders include at least one food item (has_food_item). Orders with food have higher median spend than drinks-only orders, as expected. The split (with vs without food) and the median-spend comparison show that food is a meaningful driver of basket size and that a sizable minority of visits are “food + drink” occasions.
What drives total spend
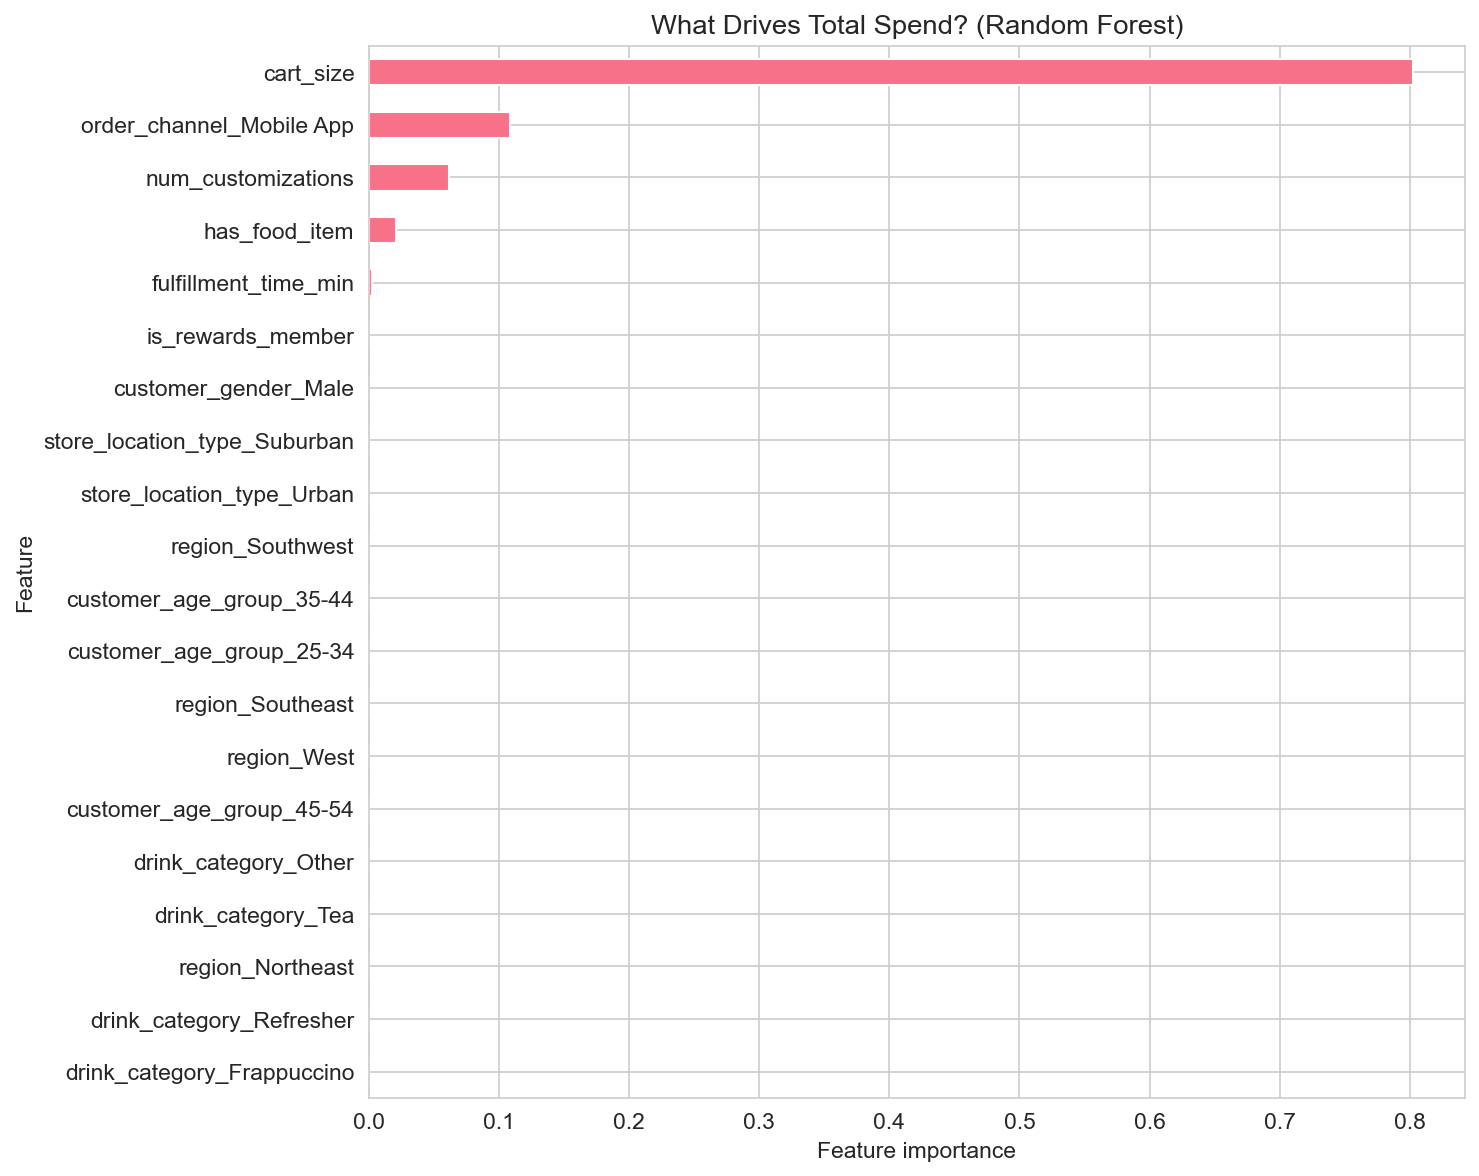
We modeled total spend using a Random Forest with features: order channel, store location type, region, customer age group, gender, drink category, cart size, number of customizations, fulfillment time, rewards membership, food item, and order-ahead. The model explains about 97% of the variance in out-of-sample spend (R² ≈ 0.97 on the test set), so spend is highly predictable from these variables in this sample.
Feature importance highlights the main drivers. Cart size is the dominant predictor, followed by drink category and other basket/order attributes. Order channel, region, store location type, demographics, rewards, order ahead, and fulfillment time contribute additional structure. So basket size and product mix are the primary levers; channel, location, and customer segment add further explanatory power. Operators can use this to anticipate spend by segment and channel; customers can see how basket and channel choices relate to typical check size.
Practical takeaways
For customers
- Median order spend in this sample is about $14; basket size (cart size), food, and customizations push spend up.
- Mobile App and order ahead are associated with higher median spend and often with higher mean satisfaction; use them if you want convenience and typically larger orders.
- Time of day and day of week affect both wait and basket mix; morning and lunch peaks are busiest.
For Starbucks and operators
- Cart size and drink category are the strongest predictors of spend; promotions and layout that support add-ons and food pairings can lift basket size.
- Rewards members and order-ahead users show higher median spend; loyalty and app adoption align with revenue.
- Fulfillment time and satisfaction are linked; improving speed and consistency by channel (especially Drive-Thru and peak hours) can support ratings.
- Region and store location type (Urban, Suburban, Rural) explain part of the variation in volume and spend; use local mix and labor to match demand.
Conclusion
The Starbucks ordering sample we analysed shows median spend around $14 and mean satisfaction about 3.7 (on a 1–5 scale), with clear patterns by channel, time, geography, and demographics. The Mobile App leads in order share; Refreshers and Brewed Coffee lead among drink categories. Rewards members and order-ahead orders have higher median spend; food attachment is present in about a third of orders and lifts spend. A Random Forest model of total spend achieves an R² of about 0.97, with cart size and drink category as the top drivers. Whether you’re a customer curious about how others order or an operator optimising assortment and operations, this kind of data makes ordering behavior and its drivers concrete.
Data and methodology
The analysis uses the Starbucks Customer Ordering Patterns dataset (Kaggle: likithagedipudi/starbucks-customer-ordering-patterns): orders with customer_id, order_id, order_date, order_time, day_of_week, order_channel, store_id, store_location_type, region, customer_age_group, customer_gender, is_rewards_member, cart_size, num_customizations, total_spend, fulfillment_time_min, drink_category, has_food_item, order_ahead, and customer_satisfaction. We parsed dates and extracted hour from order time; we converted boolean-like columns to True/False where needed. We trimmed the top and bottom 1% of total spend and fulfillment time to reduce outlier impact. Figures were generated with pandas and seaborn; the spend model used scikit-learn’s Random Forest. All results are indicative of the sample and time period covered by the dataset. Dataset credit: Starbucks Customer Ordering Patterns (Kaggle, likithagedipudi).


