

What does a large sample of Spotify tracks look like in terms of popularity, length, genre, and the audio features that describe how danceable, energetic, or acoustic they are? This post uses the Spotify Tracks Dataset by yashdev01 on Kaggle: about 114,000 tracks with track metadata, popularity, duration, explicit flag, and Spotify’s audio features (danceability, energy, key, loudness, mode, speechiness, acousticness, instrumentalness, liveness, valence, tempo, time signature) plus a genre label. We explore how popularity and duration are distributed, how the catalogue is split across 114 genres, how audio features relate to each other and to popularity, what “genre signatures” look like, and how explicit content and other dimensions (tempo, key, duration by genre) show up in the data. The result is a data-backed snapshot of the structure of this track set and what it can and can’t tell us about listening.
The dataset at a glance
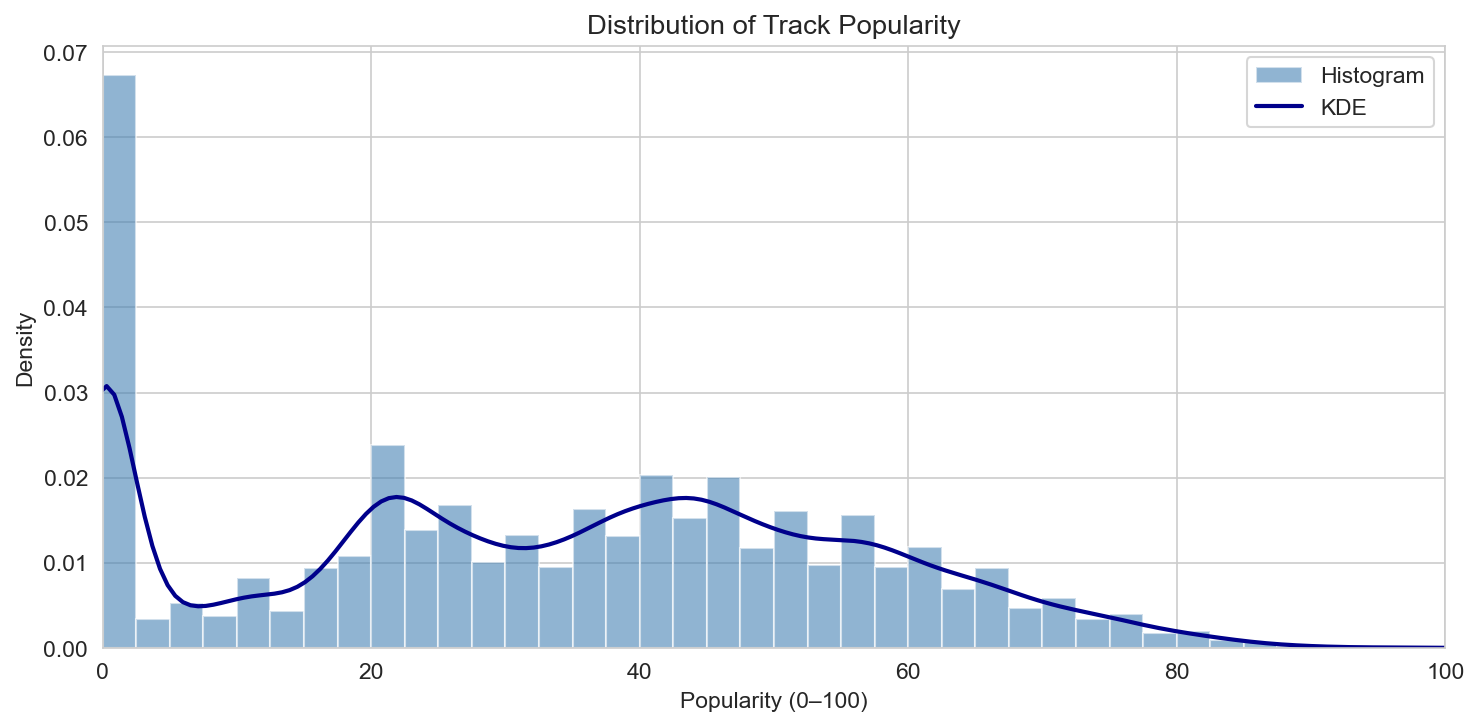
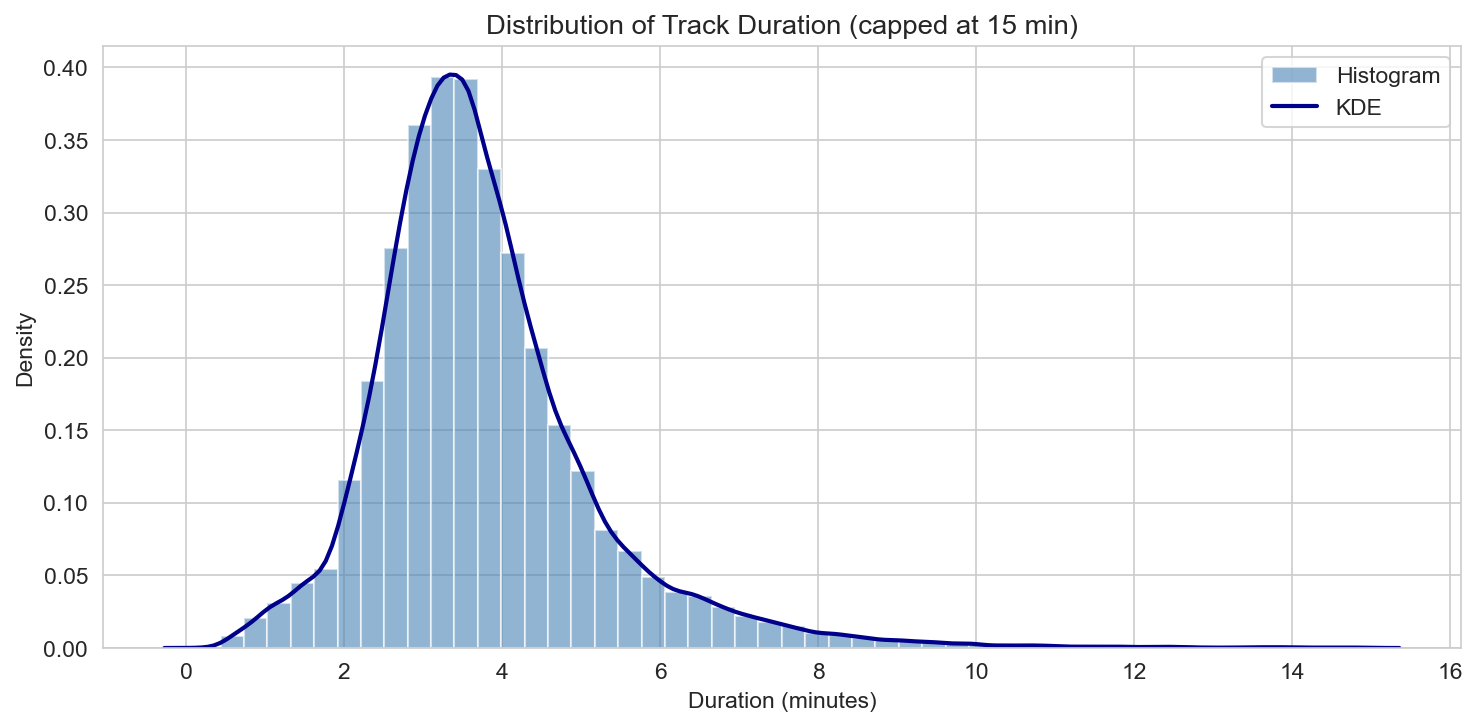
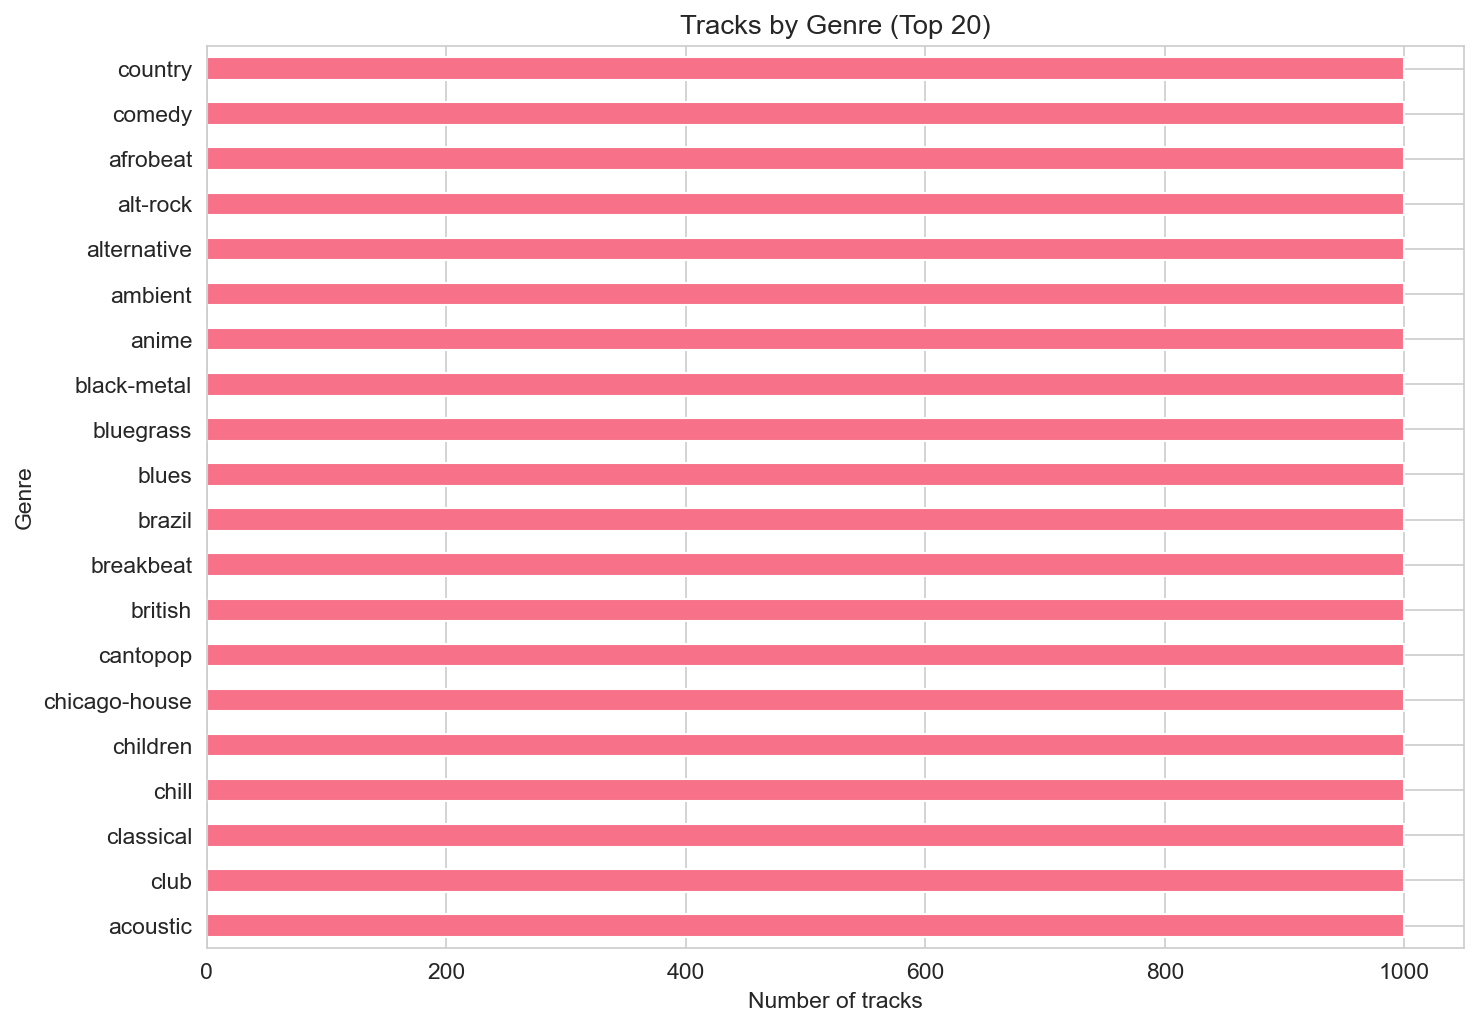
After dropping index columns and keeping only rows with valid duration and popularity (0–100), we have 113,999 tracks. The dataset is genre-balanced: there are 114 genres, and each genre has (in the raw data) about 1,000 tracks, so no single genre dominates by count. Median popularity is 35 and the mean is about 33.2—the distribution is right-skewed, with many tracks at lower popularity and a long tail of hits. Median duration is about 3.5 minutes and the mean is about 3.8 minutes; most tracks sit in the 2–5 minute band, with a long tail of longer tracks. About 8.6% of tracks are marked explicit. Together, this gives a picture of a large, genre-diverse catalogue where most tracks are not blockbuster hits and where “typical” length is in the familiar three-to-four-minute range.
Popularity and duration
Popularity (Spotify’s 0–100 metric) has a right-skewed distribution: the histogram and KDE show a peak in the lower range (roughly 20–40) and a long tail toward higher values. So in this sample, “average” tracks sit in the 30s, and only a minority reach high popularity. Duration (in minutes) is right-skewed as well: the bulk of tracks fall between about 2 and 5 minutes, with a tail of longer songs (we cap the plot at 15 minutes for readability). Outliers include very short clips and long albums or live cuts. These two distributions set the stage: we’re looking at a mix of mainstream-length tracks with a wide spread of popularity, not a chart-only subset.
Genres and track counts
With 114 genres and roughly 1,000 tracks per genre, the tracks-by-genre bar chart (top 20) shows a flat structure: counts are similar across genres. The top 20 includes a mix of familiar labels (e.g. pop, rock, hip-hop, acoustic, jazz, classical, electronic) and more niche tags. So the dataset is well-suited to compare behavior across genres rather than to describe which genre is “biggest” in the wild; the balance is by design.
Audio features and how they relate
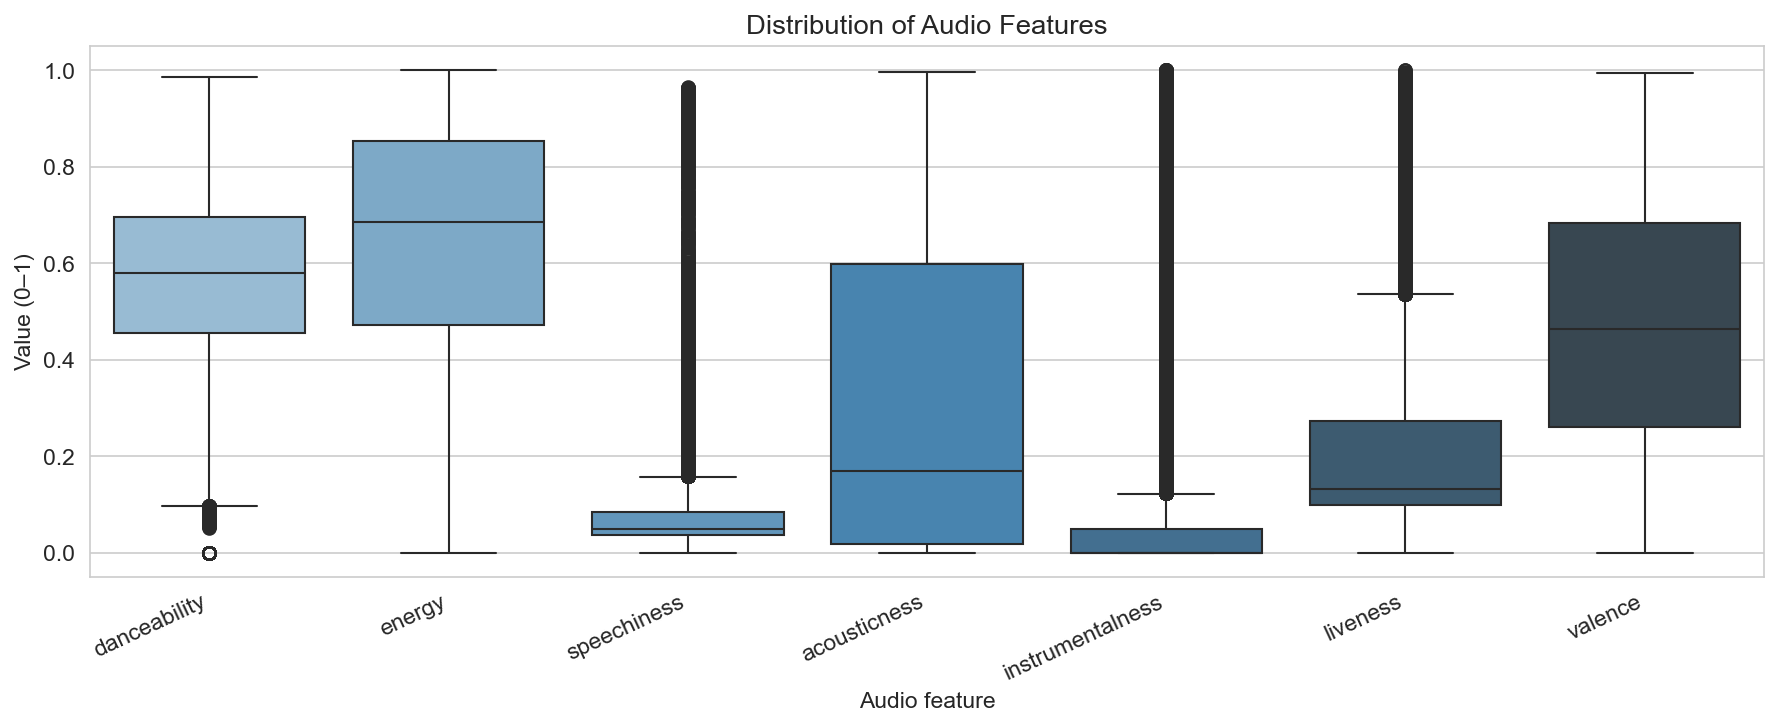
Spotify’s audio features (danceability, energy, speechiness, acousticness, instrumentalness, liveness, valence) are on 0–1 scales (or equivalent). The boxplot panel shows that most features have wide distributions: danceability and energy are spread across the range; acousticness and instrumentalness are heavily right-skewed (many tracks near 0, long tail toward 1); valence and speechiness sit in the middle with notable spread. So the catalogue spans many “moods” and production styles.
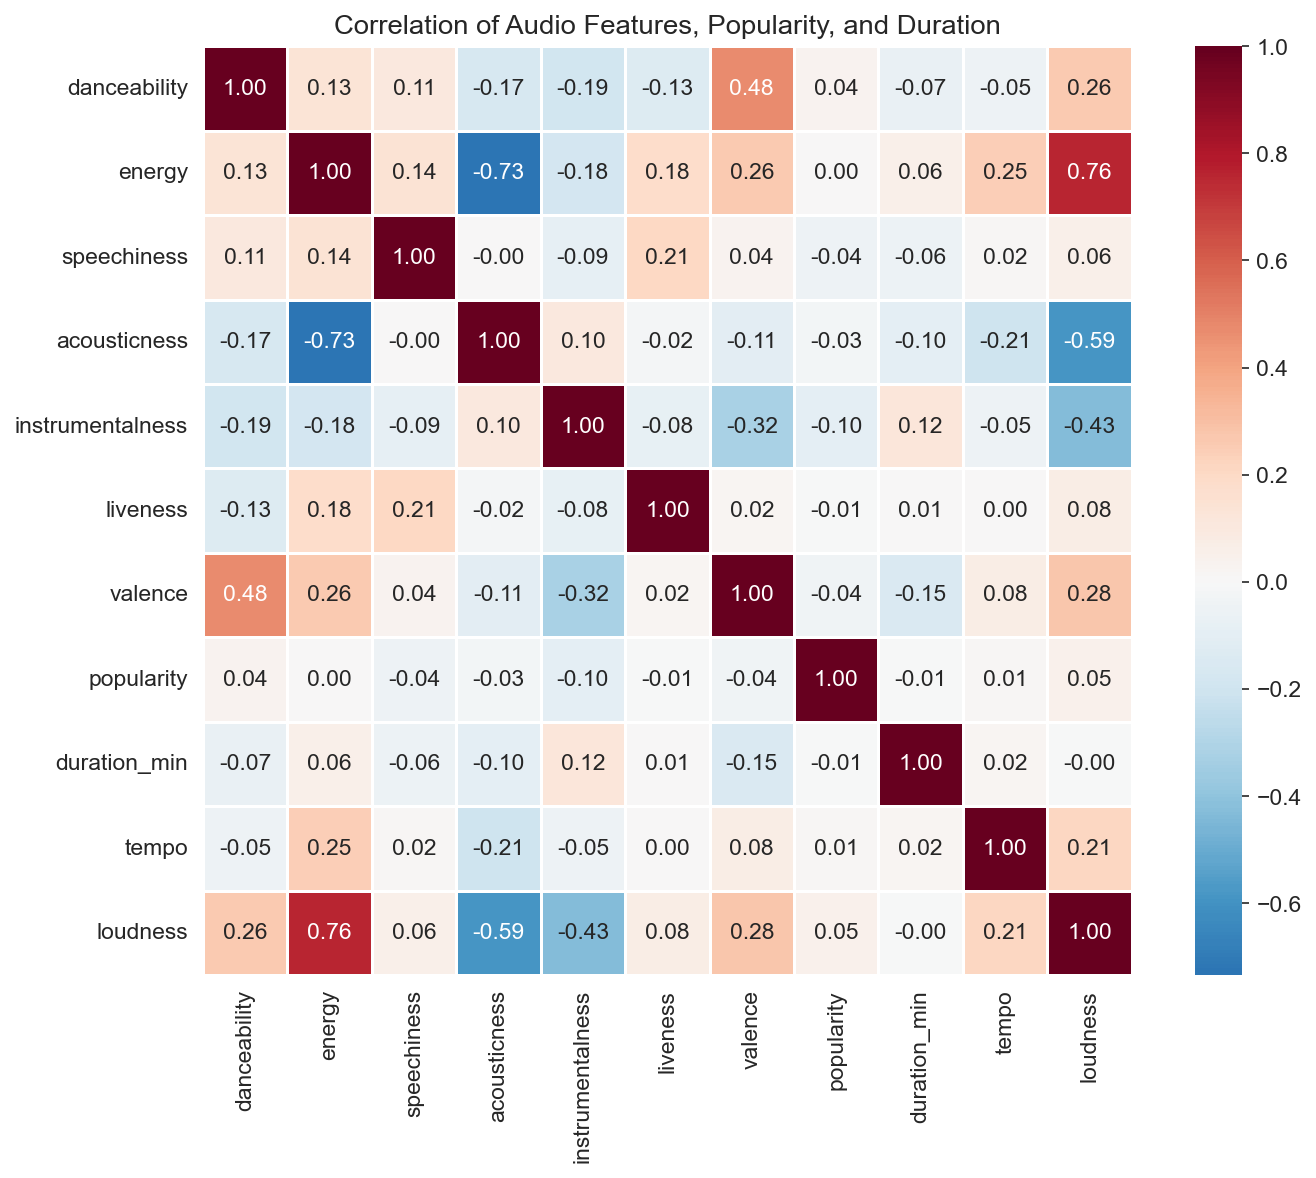
The correlation heatmap (audio features plus popularity, duration, tempo, loudness) shows that popularity is only weakly correlated with energy (about 0.001) and danceability (about 0.035) in this sample—so “what’s popular” doesn’t boil down to a simple energy or danceability story. Stronger correlations appear among the features themselves: for example, acousticness and energy tend to be negatively related; loudness and energy are positively related. Duration and popularity are only weakly related. So popularity in this set is not strongly explained by these audio features alone; other factors (playlisting, artist reach, release timing) likely dominate.
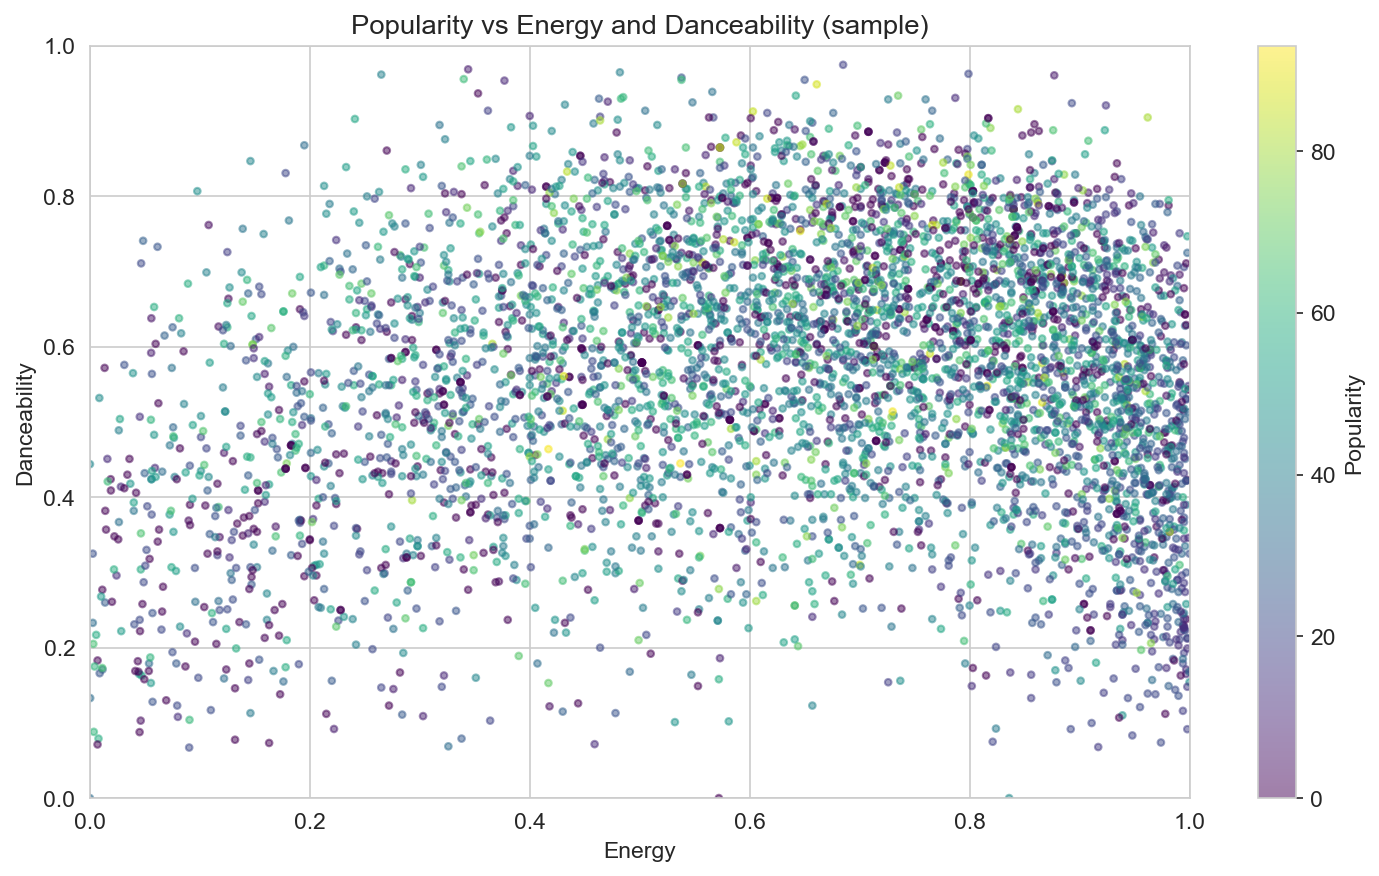
The scatter of popularity vs energy and danceability (with color = popularity) underlines that: high- and low-popularity tracks appear across the full energy–danceability plane. There is no narrow “sweet spot”; the cloud is diffuse, which is consistent with weak linear correlations.
Genre signatures
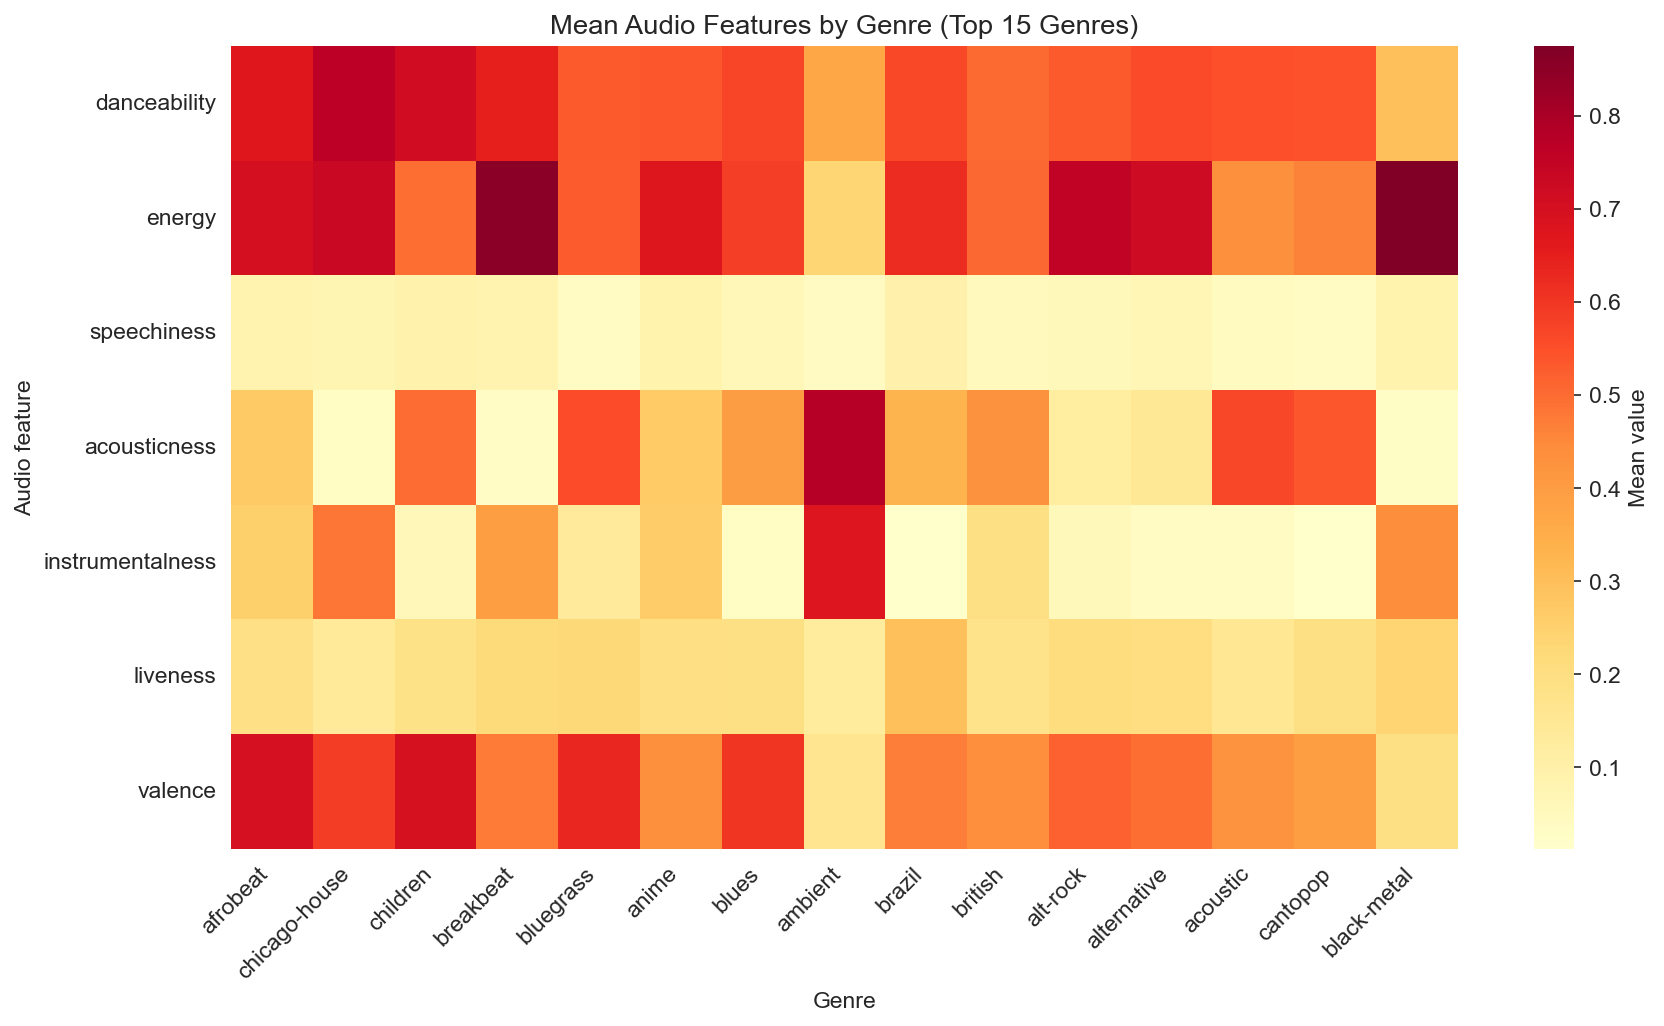
Mean audio features by genre (heatmap for the top 15 genres by count) give a “signature” per genre: which features are high or low on average. For example, acoustic and folk tend to have higher acousticness; metal and rock tend to have higher energy; classical and ambient can show higher instrumentalness. Pop and dance sit in more “middle” territory on several features. So genres do separate on average in feature space, even though there is plenty of overlap—genre labels capture real differences in the aggregate, even if they don’t define rigid boundaries.
Explicit content and other dimensions
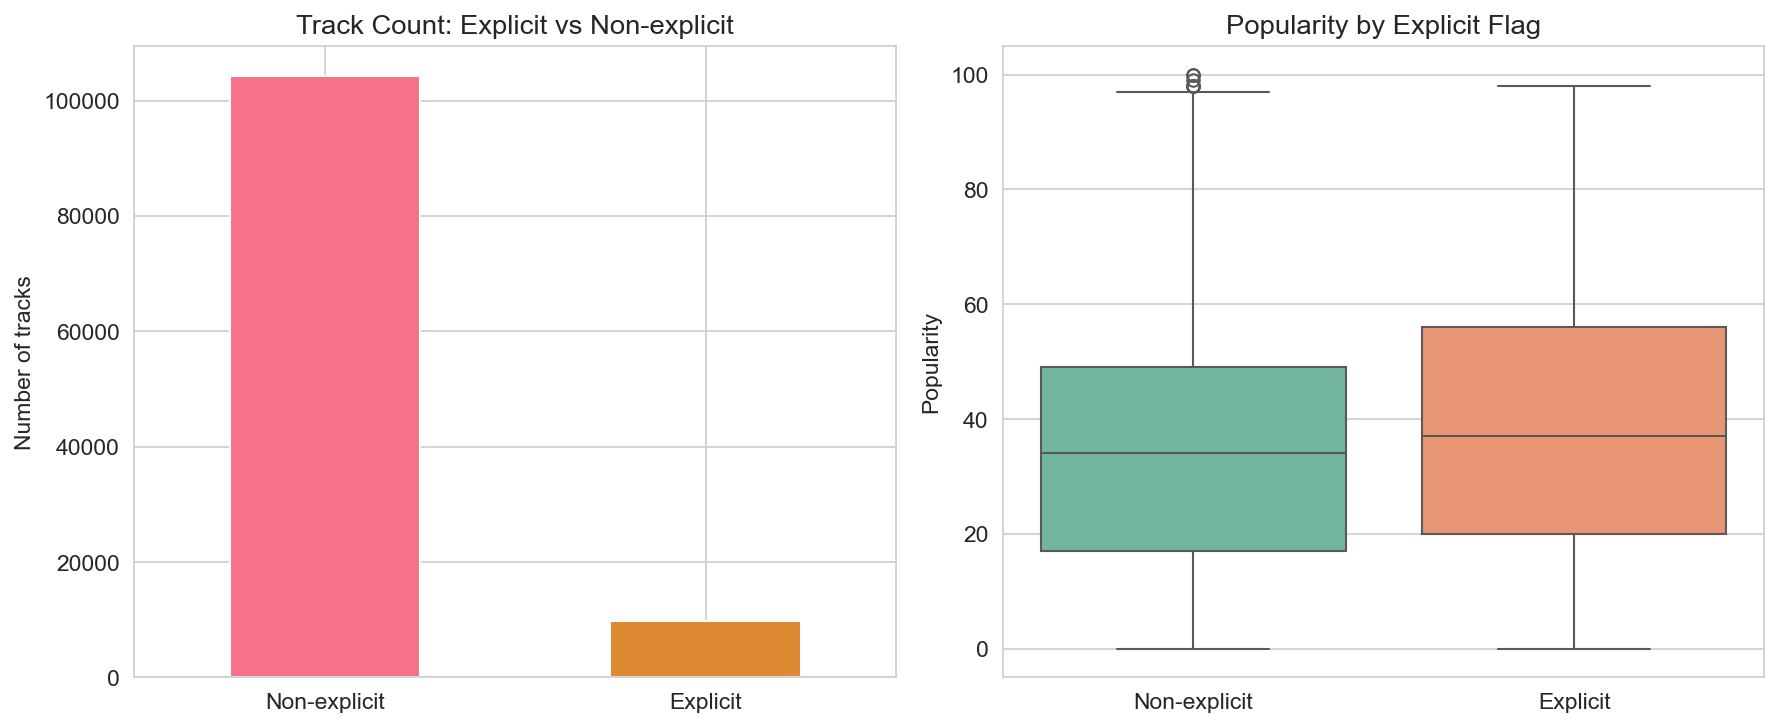
Explicit tracks make up about 8.6% of the sample. The count plot (explicit vs non-explicit) shows the strong imbalance. The popularity boxplot by explicit flag shows that, in this dataset, explicit and non-explicit tracks have similar median and spread of popularity—so we don’t see a clear “explicit = more or less popular” effect here; the difference is mainly in share of catalogue.
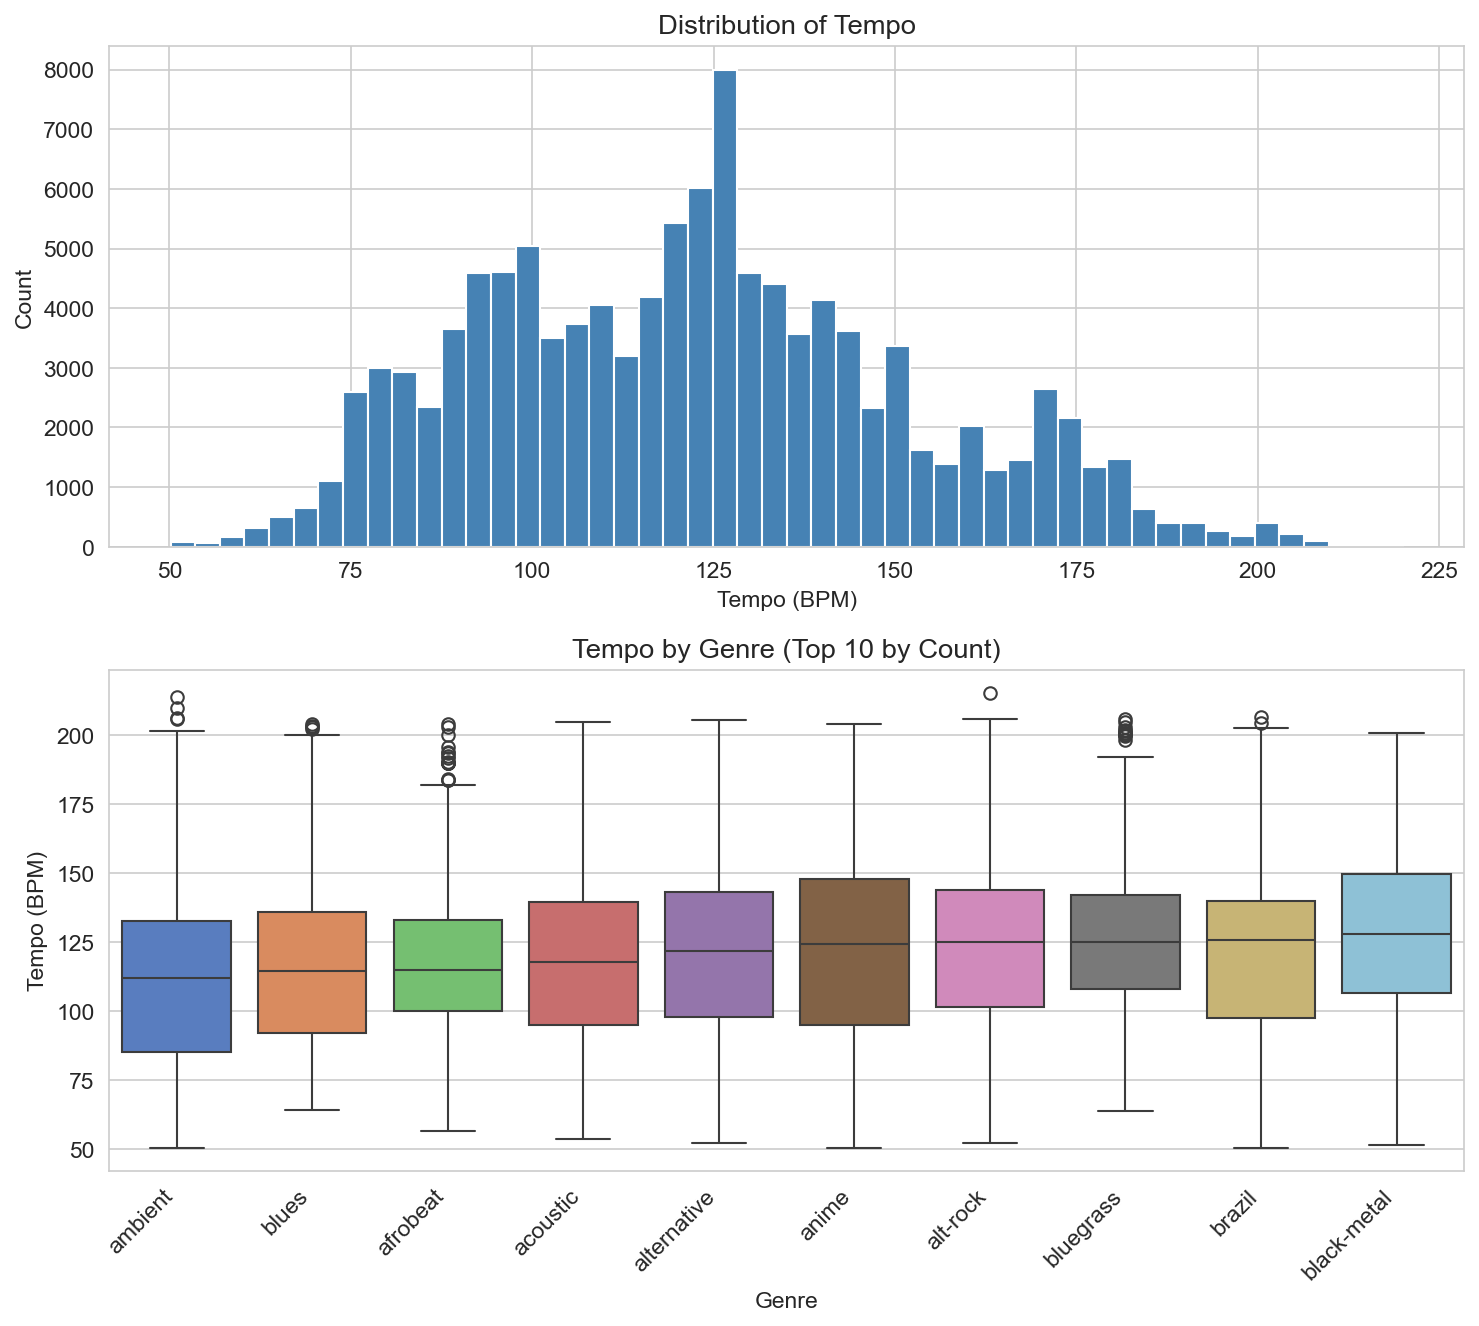
Tempo (BPM) is roughly unimodal in the 80–120 range, with a long tail toward higher and lower values. Tempo by genre (top 10 genres) shows that some genres (e.g. dance, electronic) tend to sit higher in BPM; others (e.g. acoustic, ambient) lower. So tempo is another dimension along which genres differ on average.
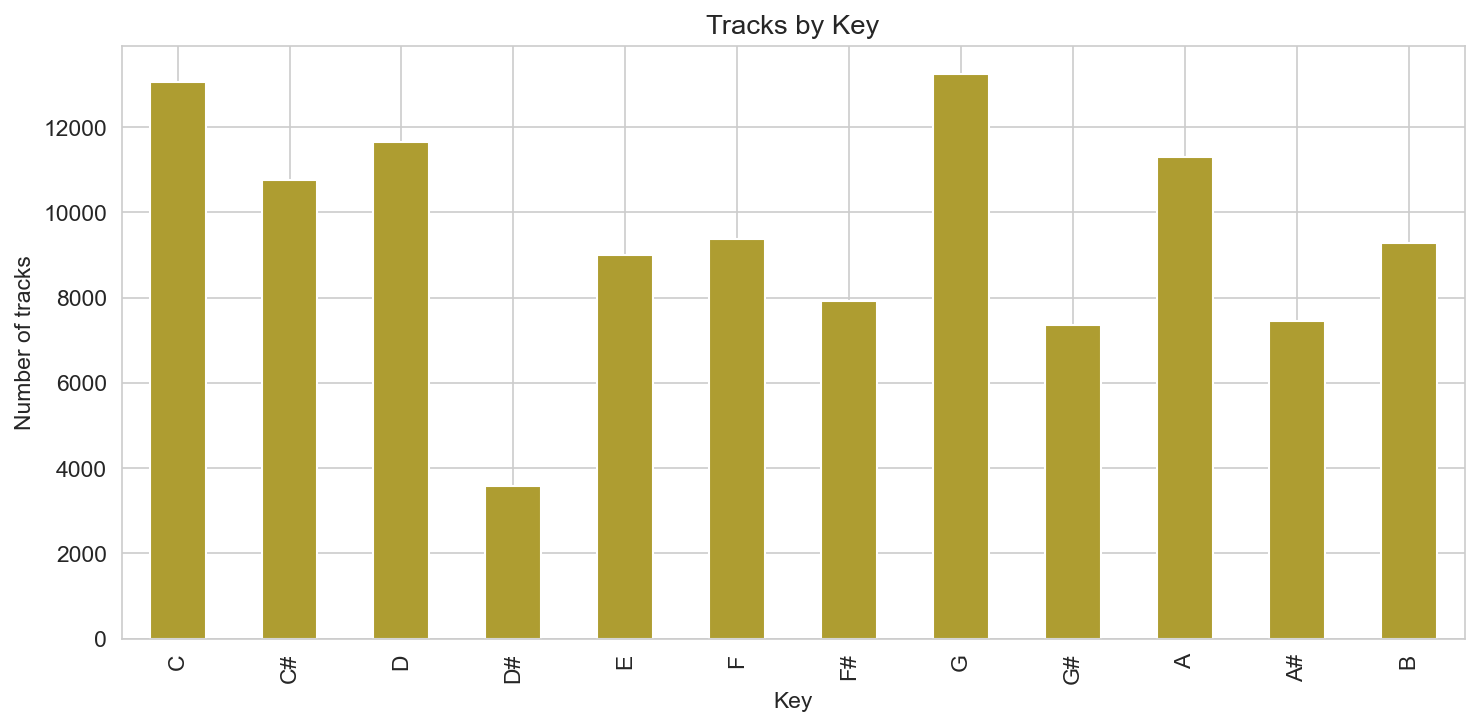
Key (pitch class 0–11, C through B) is not uniform: some keys appear more often than others in the dataset, which may reflect both musical convention and the way tracks are tagged or chosen for the sample. The key distribution bar chart makes that variation visible.
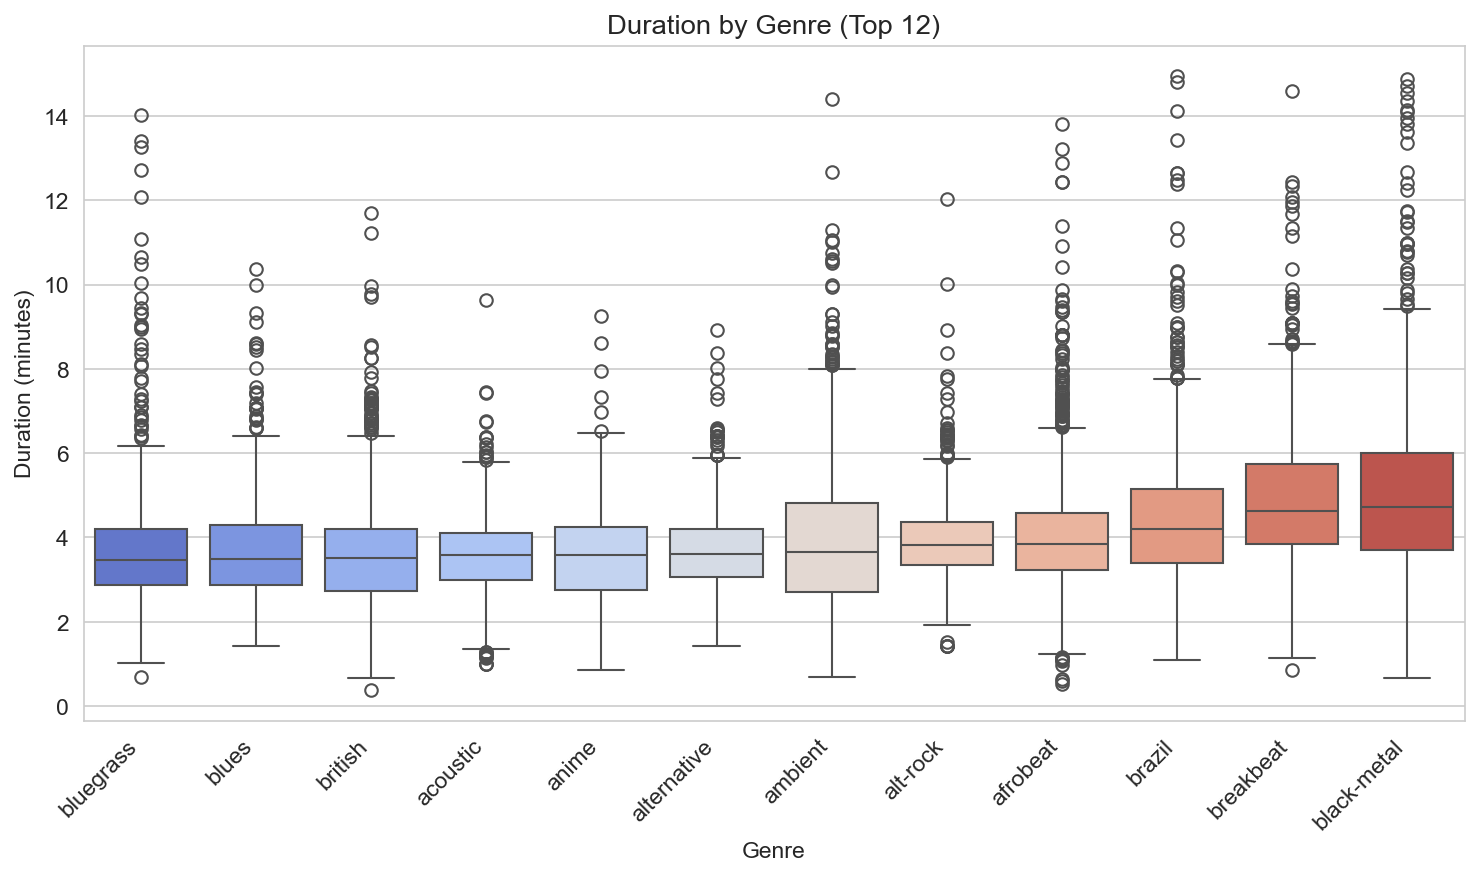
Duration by genre (top 12) shows that median track length varies by genre: some genres (e.g. classical, ambient) have longer median duration; others (e.g. pop, punk) tend to be shorter. So “typical length” is genre-dependent, which fits the idea that format and style differ by genre.
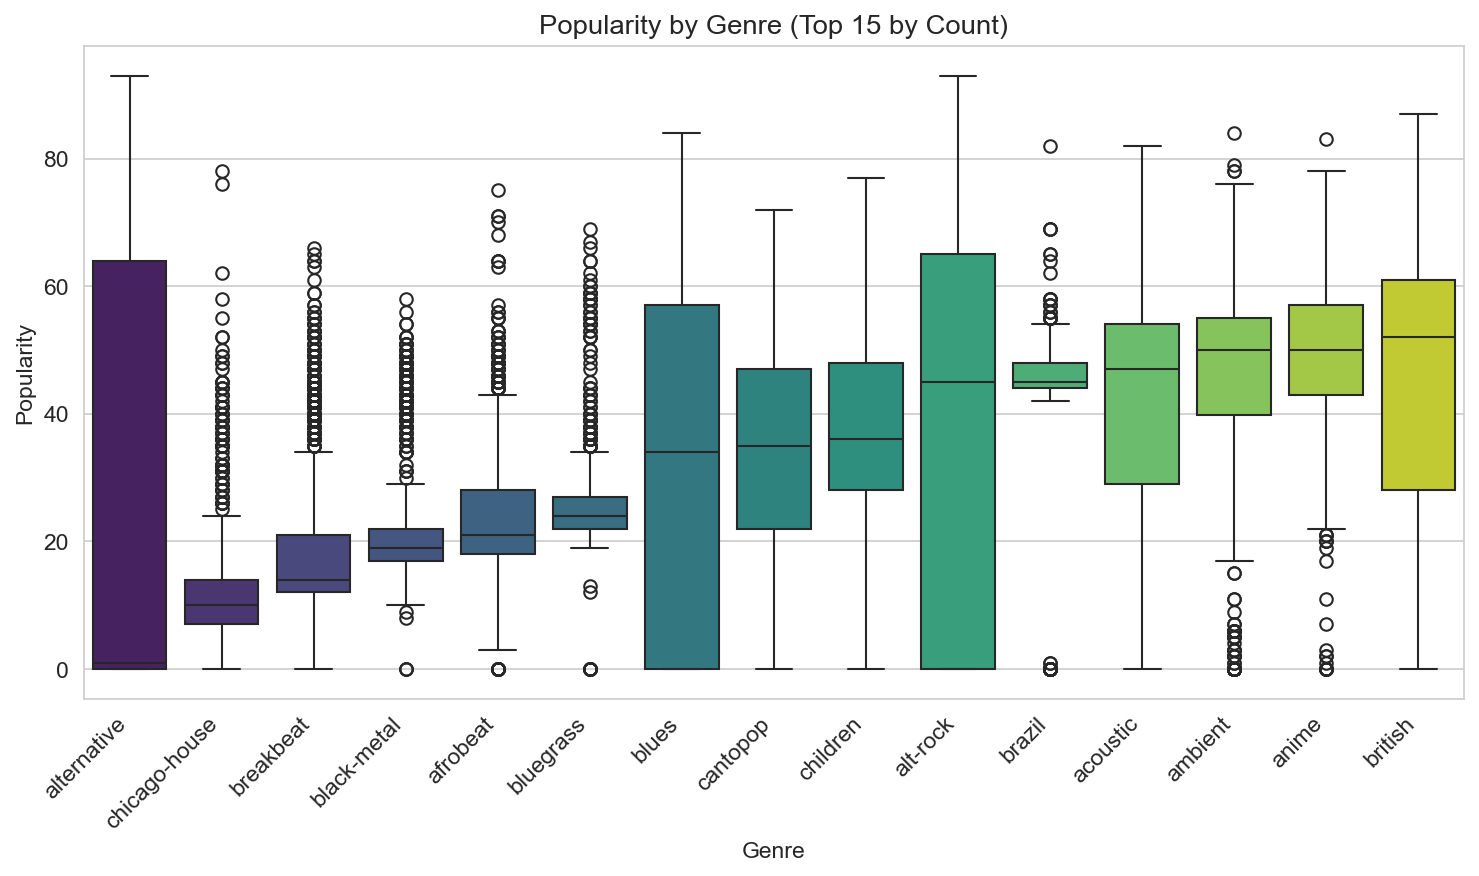
Popularity by genre (top 15) shows median popularity and spread per genre. Some genres have a higher median popularity in this sample; others sit lower. That could reflect how the dataset was built (e.g. sampling or balancing) as much as “real-world” popularity, so we read this as “within-this-dataset” variation rather than a claim about global streaming charts.
Takeaways
- Popularity in this set is right-skewed (median 35, mean ~33); most tracks are not huge hits. Duration is typically 3–4 minutes, with a long tail of longer tracks.
- The dataset is genre-balanced (114 genres, ~1,000 tracks each), so it’s good for comparing genres rather than estimating global genre shares.
- Audio features (danceability, energy, valence, etc.) are weakly correlated with popularity here; popularity is likely driven more by playlist placement, artist reach, and release context than by these features alone.
- Genres have distinct “signatures” in mean audio features (e.g. acousticness, energy, instrumentalness), so genre labels carry information about the aggregate sound, even with lots of overlap.
- Explicit tracks are a small minority (~8.6%) and don’t show a clear popularity advantage or penalty in this sample. Tempo and duration vary meaningfully by genre; key is unevenly distributed.
For anyone building models or doing research on this dataset: treat popularity as a noisy, context-dependent outcome; use genre as a useful but overlapping categorical signal; and lean on the audio features for describing sound, while remembering they don’t tell the whole story of why a track gets streamed.
Data and methodology
The analysis uses the Spotify Tracks Dataset (Kaggle: yashdev01/spotify-tracks-dataset): tracks with track_id, artists, album_name, track_name, popularity, duration_ms, explicit, and audio features danceability, energy, key, loudness, mode, speechiness, acousticness, instrumentalness, liveness, valence, tempo, time_signature, and track_genre. We dropped index/unnamed columns, coerced numeric columns, normalized the explicit flag to boolean, and kept only rows with duration > 0 and popularity in 0–100. Figures were generated with pandas and seaborn; all plots use the cleaned sample of 113,999 tracks. Results are descriptive of this dataset and time slice; they are not necessarily representative of all Spotify content. Dataset credit: Spotify Tracks Dataset (Kaggle, yashdev01).


