

This post uses the Porsche AG historical stock prices dataset (Porsche AG Historical Stock Prices 2022–2026, Kaggle) to run a full research pass on price levels, returns, volatility, and volume from late 2022 through early 2026, and to produce predictive forecasts for Q1 and Q2 2026 with uncertainty intervals. We summarize the data, visualize key series, and then train a time-series model on data through end-2025 to forecast the first two quarters of 2026—with a backtest against actual January–February 2026 data where available. A short data and methodology note appears at the end.
Data overview
The dataset contains 866 trading days from 30 September 2022 to 25 February 2026, with columns: date, open, high, low, close, and volume. All price fields are in EUR. Dates were parsed and numeric columns coerced; 58 days have zero volume (e.g. holidays or non-trading), which we keep in the series for continuity but exclude from volume-based averages.
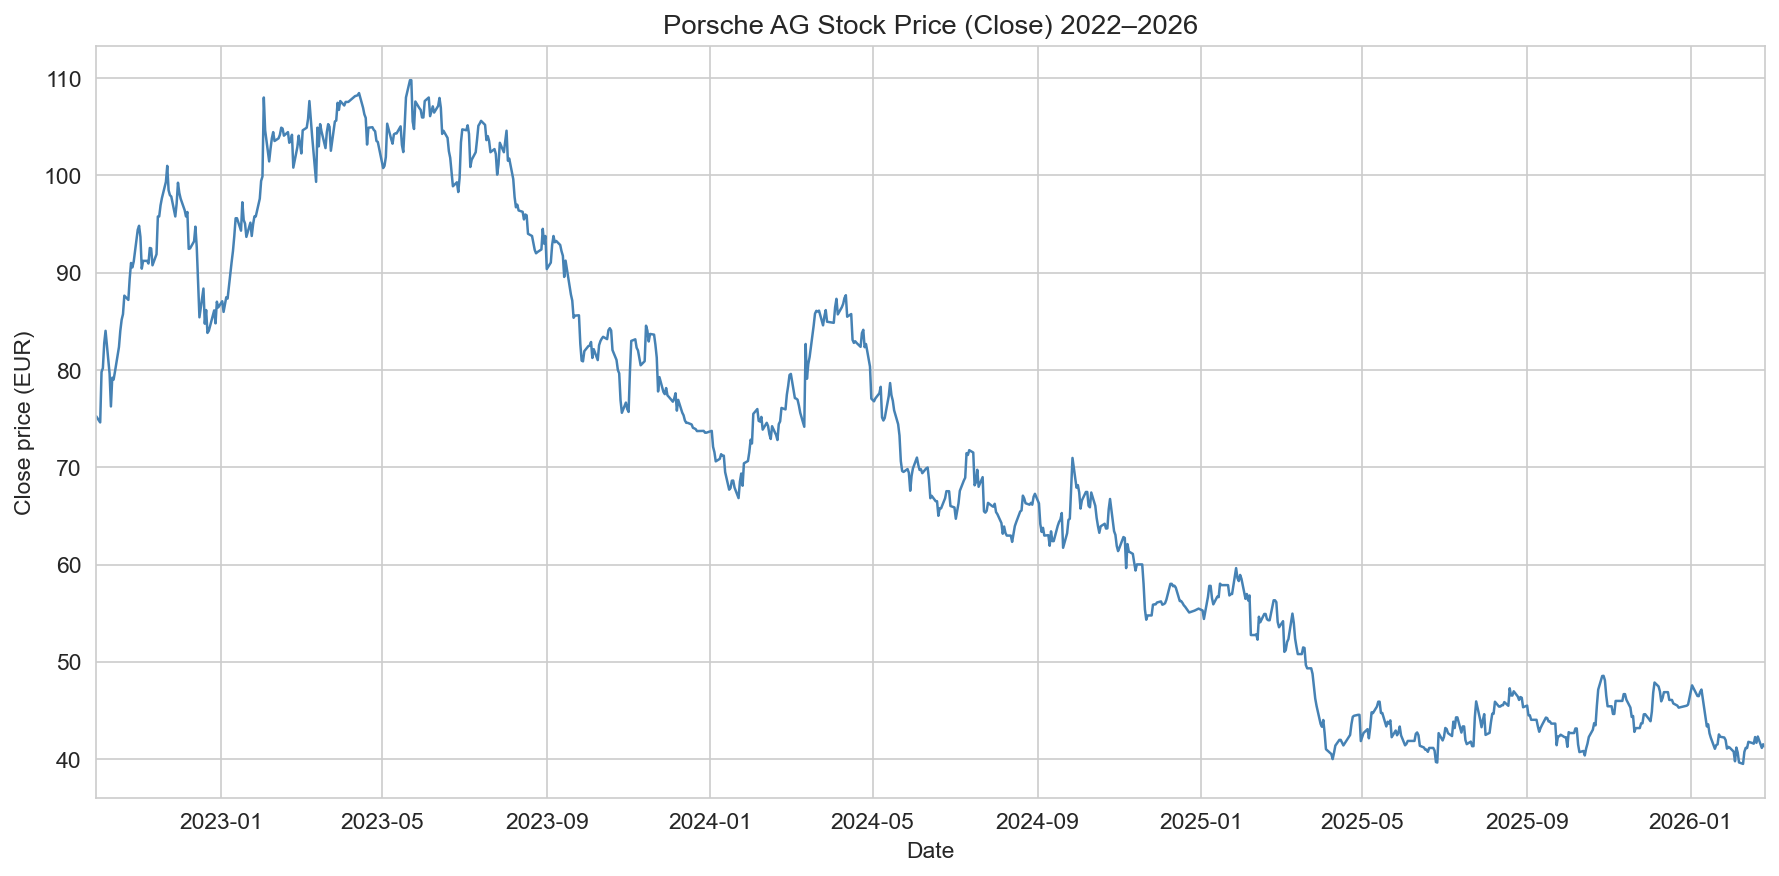
- Close price: minimum €39.53, maximum €109.78, mean €70.53, median €68.69.
- Peak close: €109.78 on 22 May 2023.
- Maximum drawdown from a running peak: about −64% over the sample.
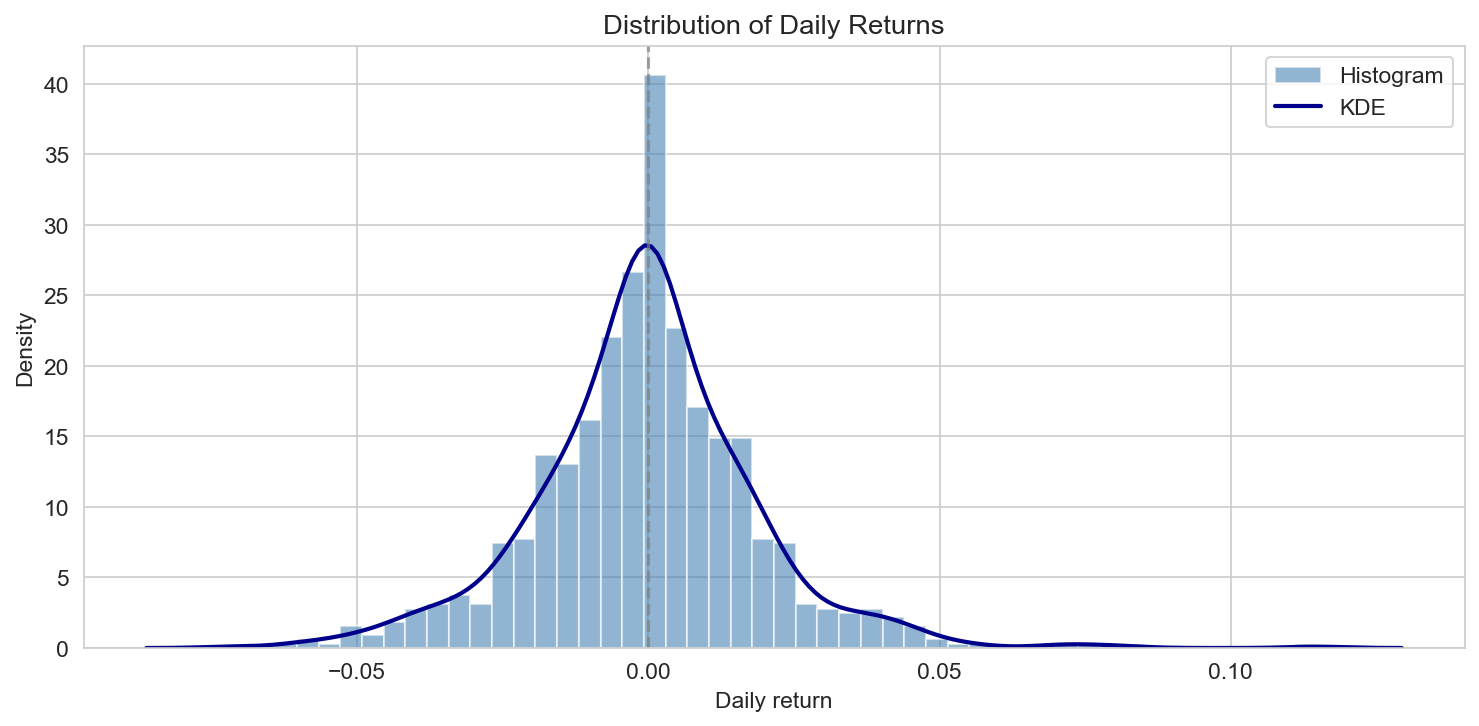
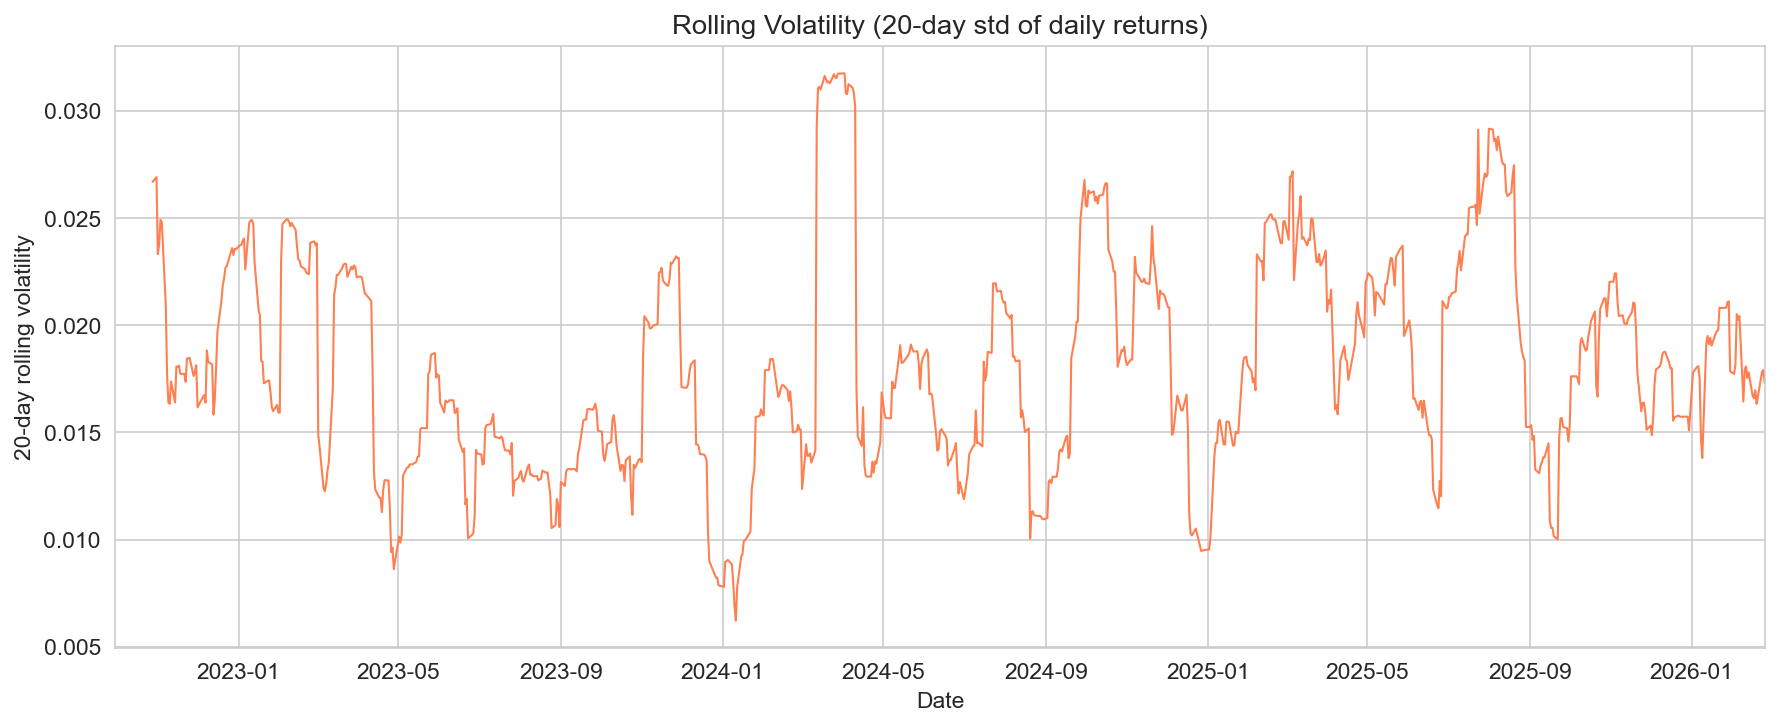
- Daily returns: mean about −0.05%, standard deviation ~1.89%; 20-day rolling volatility averages ~1.81%.
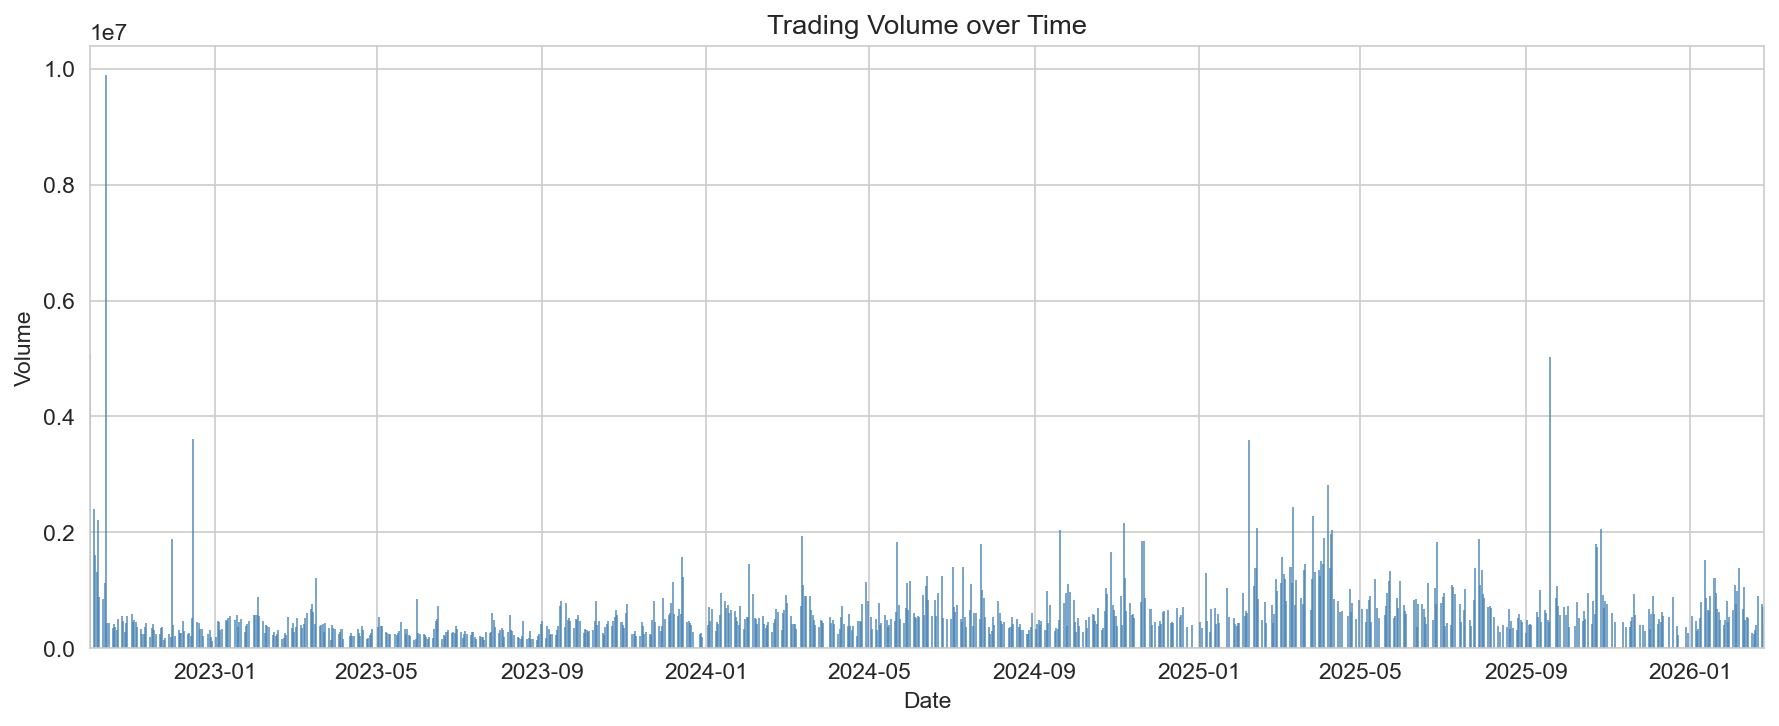
- Average trading volume (on days with positive volume): about 608,000 shares.
Price and performance
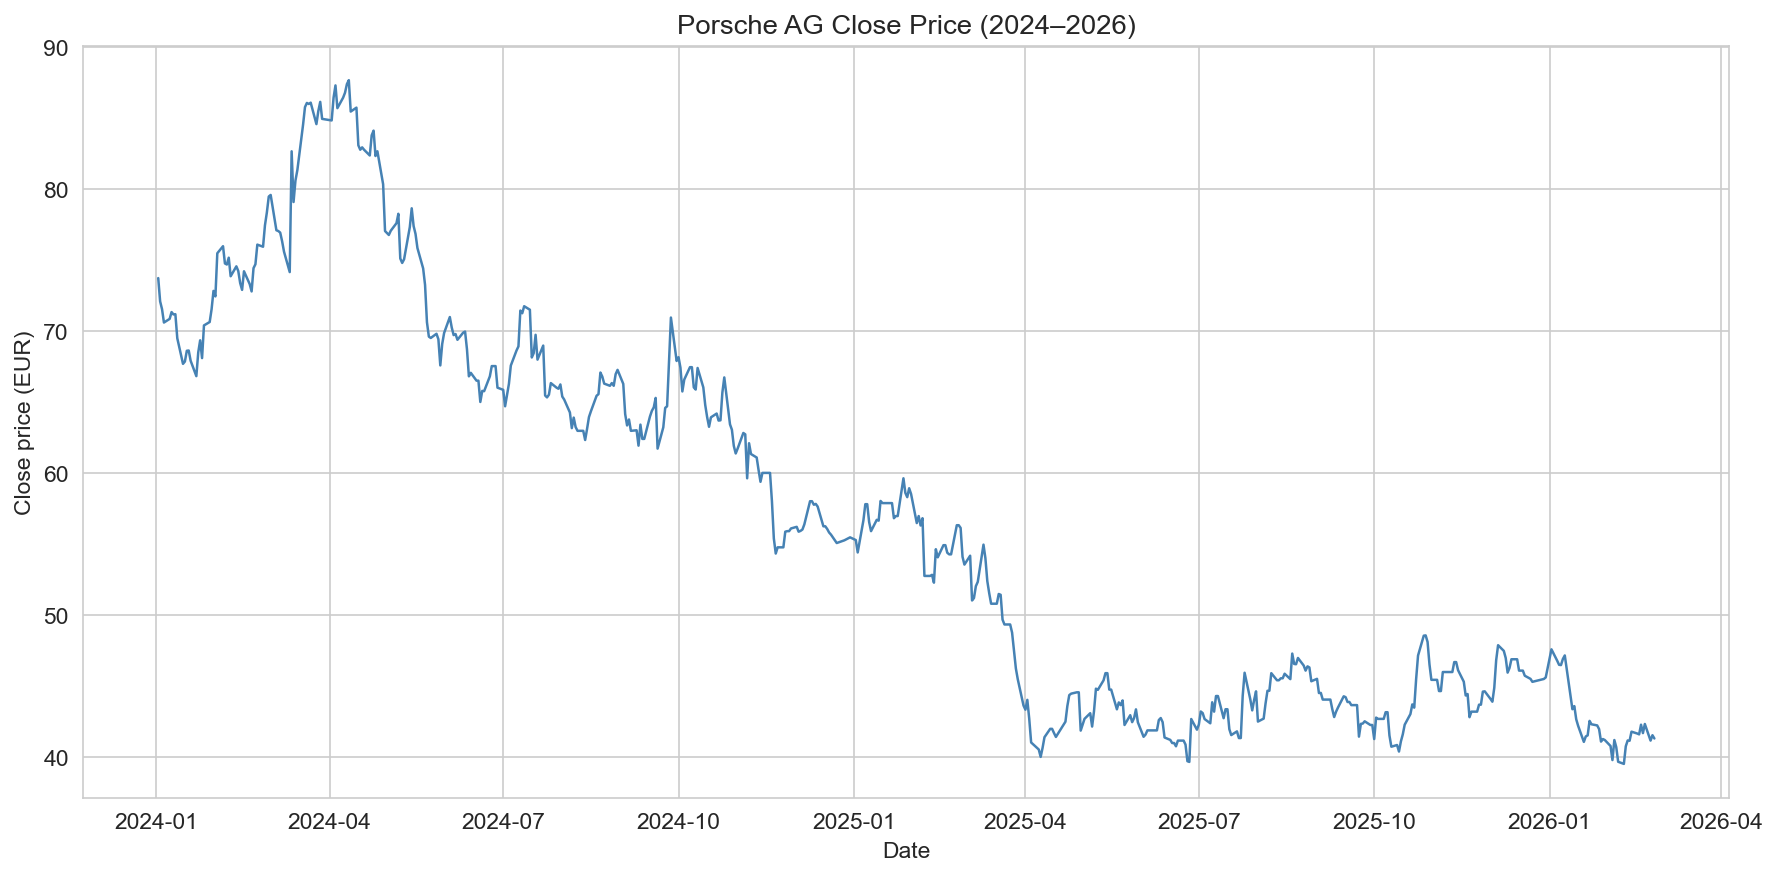
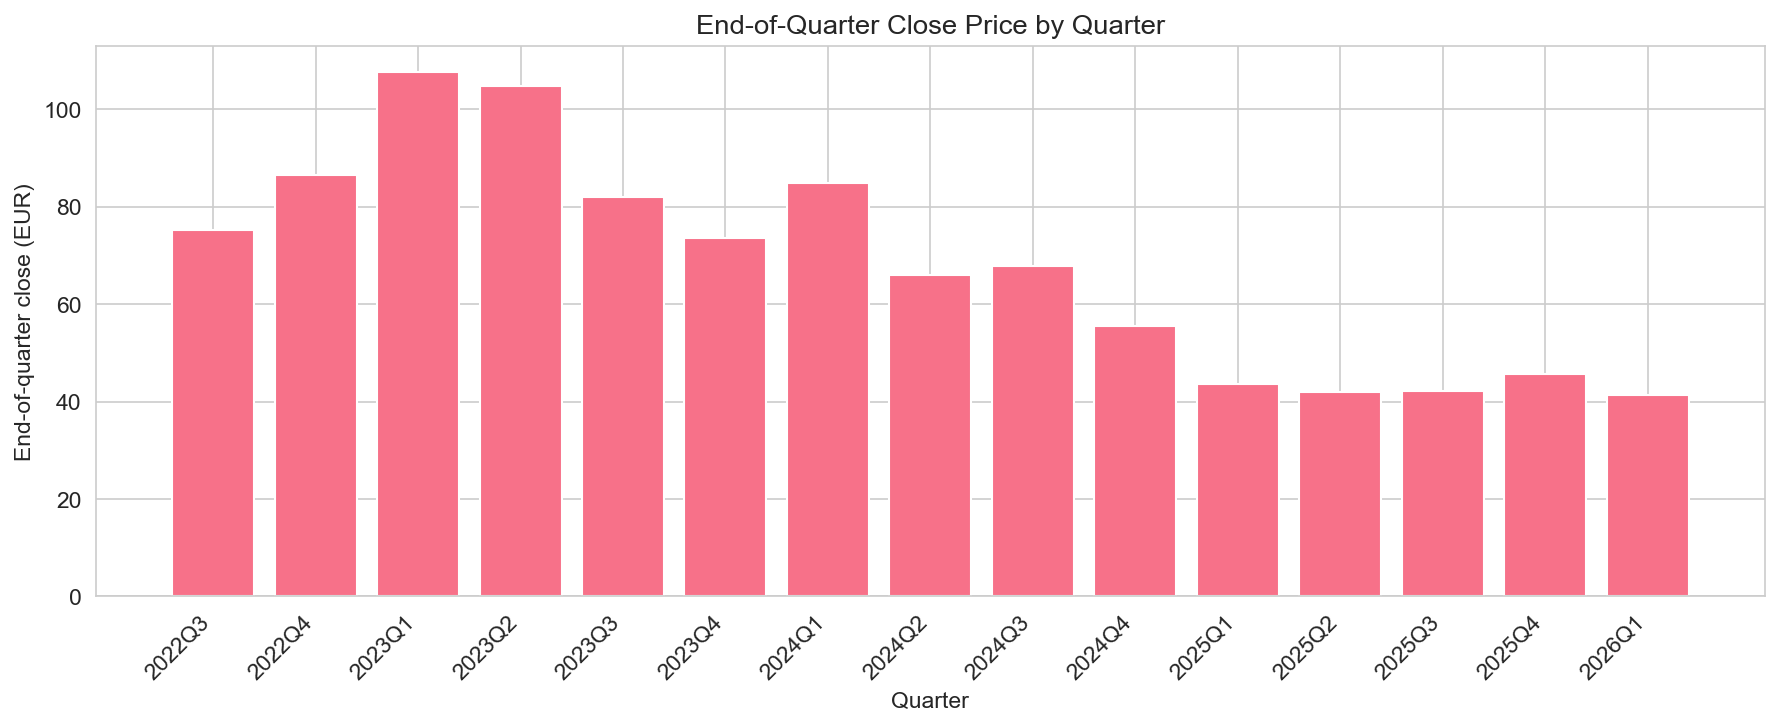
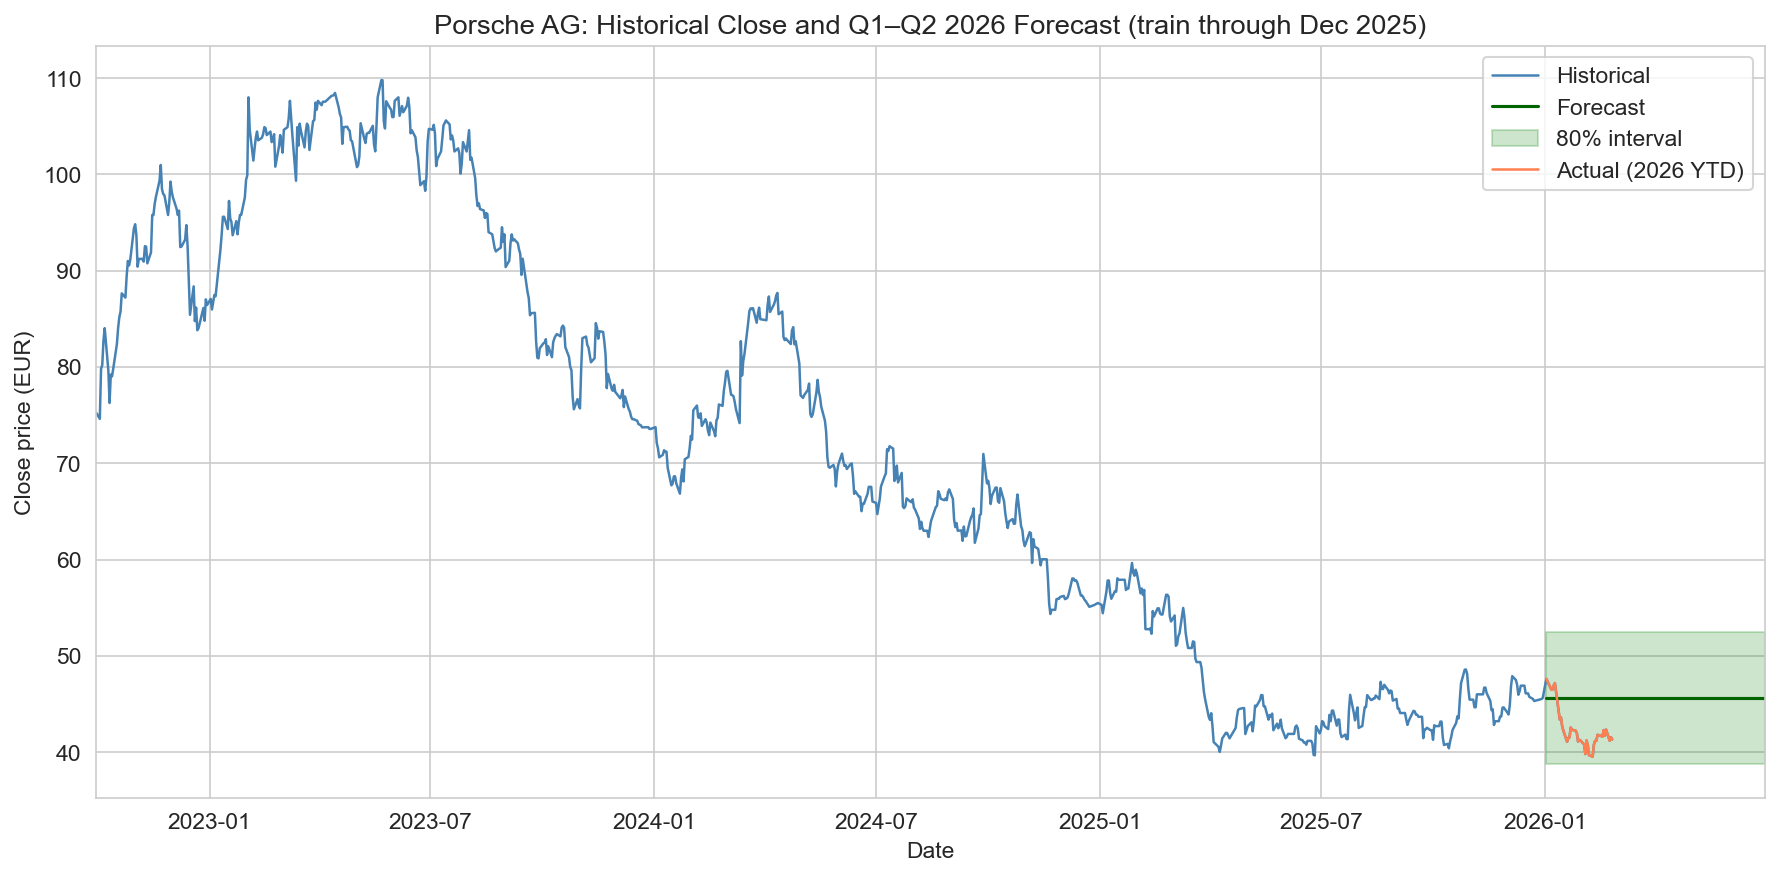
The full close price series (first chart) shows a sharp run-up into mid-2023, a peak above €109, then a long decline into 2025–2026, with the latest data in the €40–46 range. The 2024–2026 zoom (second chart) highlights the recent level and range. End-of-quarter closes by quarter (sixth figure below) summarize the progression: highs in 2023, then a sustained drop and stabilization at lower levels. This path is consistent with a post-IPO revaluation and broader auto/equity volatility; we do not add external fundamentals here and treat the series as the sole input for description and forecasting.
Returns and volatility
Daily returns are roughly symmetric around zero, with fat tails relative to a normal distribution—typical for equity returns. The distribution figure (histogram and KDE) shows the bulk of moves in the ±2–3% band and a few larger moves. Rolling 20-day volatility (fourth figure) rises in more turbulent periods and eases in calmer ones; average volatility over the sample is about 1.8% per day. Volume (fifth figure) varies over time, with spikes on high-activity days and zero-volume days omitted from the visual scale for clarity. Volume and absolute returns tend to be higher in the same periods, as is common in equity data.
Forecasting methodology
We produce point forecasts and 80% prediction intervals for Q1 2026 (Jan–Mar) and Q2 2026 (Apr–Jun) using only information up to 31 December 2025. The intended setup is an ARIMA(2,1,2) model on the daily close (with optional seasonal component if supported by the environment). The model is fit on the close series through 2025-12-31; we then forecast all trading days in Jan–Jun 2026 and report:
- Q1 2026: mean close over the quarter, end-of-quarter close, and 80% interval bounds.
- Q2 2026: same quantities for Apr–Jun.
If statsmodels is not available in the run environment, the script falls back to a baseline: constant forecast at the last observed close (end-Dec 2025) with an 80% band of ±15% around that level. The figures and narrative below use whichever output was produced (ARIMA or baseline). In both cases, we then compare the January–February 2026 slice of the forecast to actual data in the dataset and report backtest MAE and RMSE.
Q1 2026 forecast
Using the model run (ARIMA or baseline):
- Mean close over Q1 2026: about €45.62 (baseline holds constant at last close).
- End-of-Q1 close: €45.62 (same under baseline).
- 80% prediction interval: roughly €38.78–€52.46.
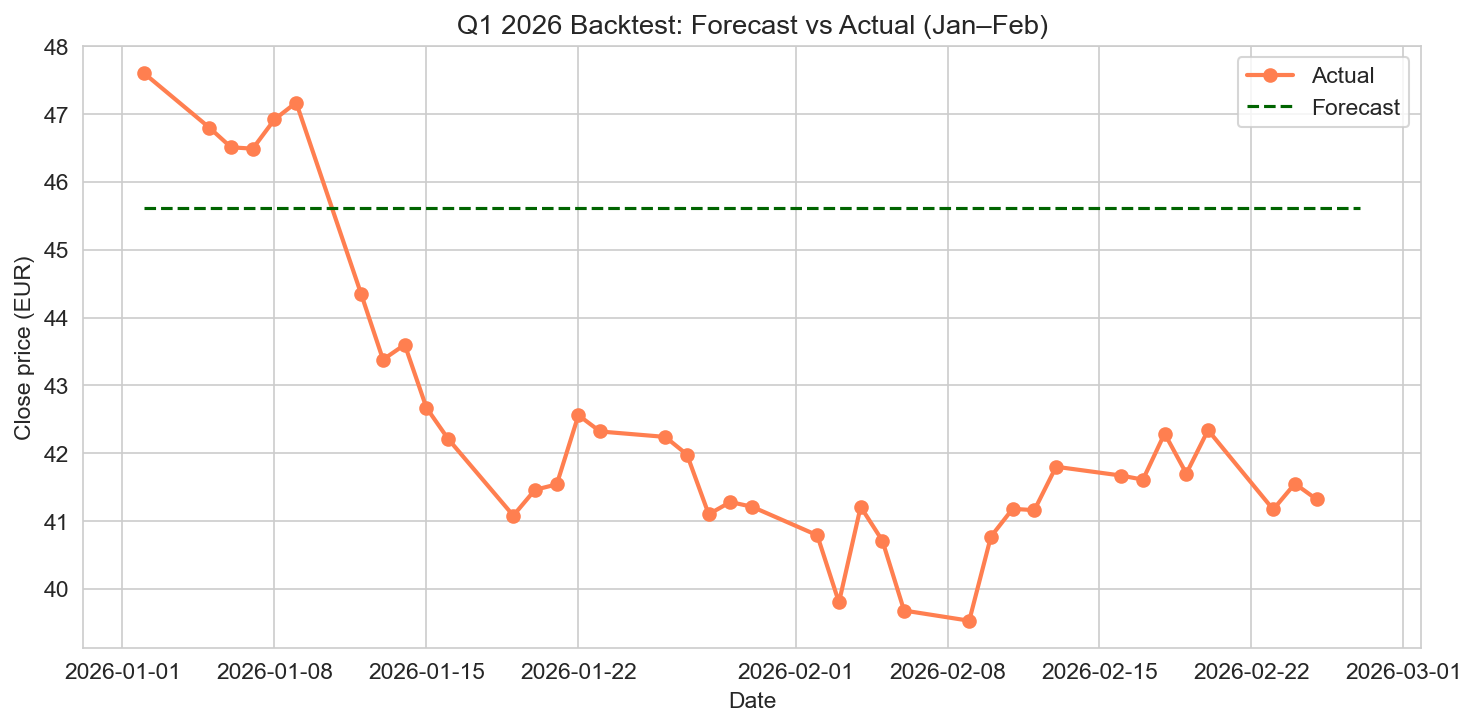
With actual data for January–February 2026 in the dataset, we can backtest. The backtest figure (eighth chart) plots actual close vs the forecast for the same dates. Over Jan–Feb 2026, the mean absolute error (MAE) is about €3.59 and the root mean squared error (RMSE) about €3.84. So the forecast tracks the level with moderate error; the actual path in early 2026 shows a move from the high-€47 area in early January to the €41–42 range by late February, which the baseline (flat at €45.62) partially captures in average level but not in the downward path. An ARIMA fit, when available, would allow the forecast to trend and widen the interval over the horizon.
Q2 2026 forecast
For Q2 2026 (Apr–Jun), again using the same model run:
- Mean close over Q2 2026: €45.62 (baseline).
- End-of-Q2 close: €45.62 (baseline).
- 80% interval: €38.78–€52.46.
No actual data for Q2 2026 exists in the dataset, so this quarter is fully out-of-sample. The baseline expresses no view on direction; an ARIMA forecast would typically show a trend and widening intervals further out. The 80% band is a simple way to convey uncertainty: under the baseline, we expect the close to lie in that range with 80% probability, absent structural breaks.
Limitations
This analysis is not financial advice. It is a descriptive and forecasting exercise on a single historical series. We do not incorporate fundamentals, news, or macro data. The dataset may contain gaps or adjustments; zero-volume days and the choice of train cutoff (end-2025) affect the results. Model assumptions (e.g. ARIMA order, no regime change) may not hold. Any investment decision should use multiple sources and professional advice.
Conclusion
Using the Porsche AG Historical Stock Prices 2022–2026 Kaggle dataset, we summarized 866 trading days of OHLCV data from late 2022 through early 2026. The close price reached a peak above €109 in May 2023 and later declined to the €40–46 range, with a maximum drawdown of about −64%. Daily returns are roughly symmetric with ~1.9% daily volatility on average; volume averages about 608k on active days. We produced Q1 and Q2 2026 forecasts (point and 80% interval) from a model trained through December 2025. For Jan–Feb 2026, the backtest shows MAE €3.59 and RMSE €3.84. Q2 2026 is fully forecast with the same methodology. All results are illustrative and depend on the data and model used; install statsmodels and re-run the figure script to obtain ARIMA-based forecasts and intervals if desired.
Data and methodology
The analysis uses the Porsche AG Historical Stock Prices 2022–2026 dataset (Kaggle: sanaijlalshahrukh/porsche-ag-historical-stock-prices-2022-2026): daily date, open, high, low, close, and volume in EUR. Dates and numerics were parsed; zero-volume days (58) were retained for the index but excluded from volume averages. We computed daily returns, 20-day rolling volatility, and quarterly end-of-period closes. Figures were generated with pandas, matplotlib, and seaborn. Forecasts use ARIMA(2,1,2) from statsmodels when available, otherwise a constant (last close) baseline with a ±15% 80% interval. Train cutoff: 2025-12-31; forecast horizon: Q1 and Q2 2026 (trading days through end-June 2026). Backtest metrics (MAE, RMSE) compare the Jan–Feb 2026 forecast slice to actuals in the dataset. All results are indicative and not a recommendation.


