

What do over 49,000 international football matches from 1872 to 2026—plus who scored, when, and how penalty shootouts were decided—tell us about how the game has been played, where it is played, and who wins when it goes to penalties? This post uses the International football results from 1872 to 2017 dataset by martj42 on Kaggle: match results (teams, scores, tournament, venue, neutral or not), goalscorer records (player, minute, penalty or open play, own goal), penalty shootout outcomes (winner and who shot first when recorded), and historical country names so we can group teams across eras (e.g. Soviet Union with Russia). We look at match volume and goals per match over time, score and draw patterns, home advantage at neutral vs non-neutral venues, top teams by matches and wins, tournaments and host countries, top international goalscorers and goal timing, the share of penalties and own goals, and whether shooting first in a penalty shootout helps. The result is a data-backed snapshot of more than 150 years of international football.
Dataset credit: All data and figures in this post are from International football results from 1872 to 2017 (Kaggle, martj42). The dataset is also available on GitHub under CC0-1.0.
The big picture
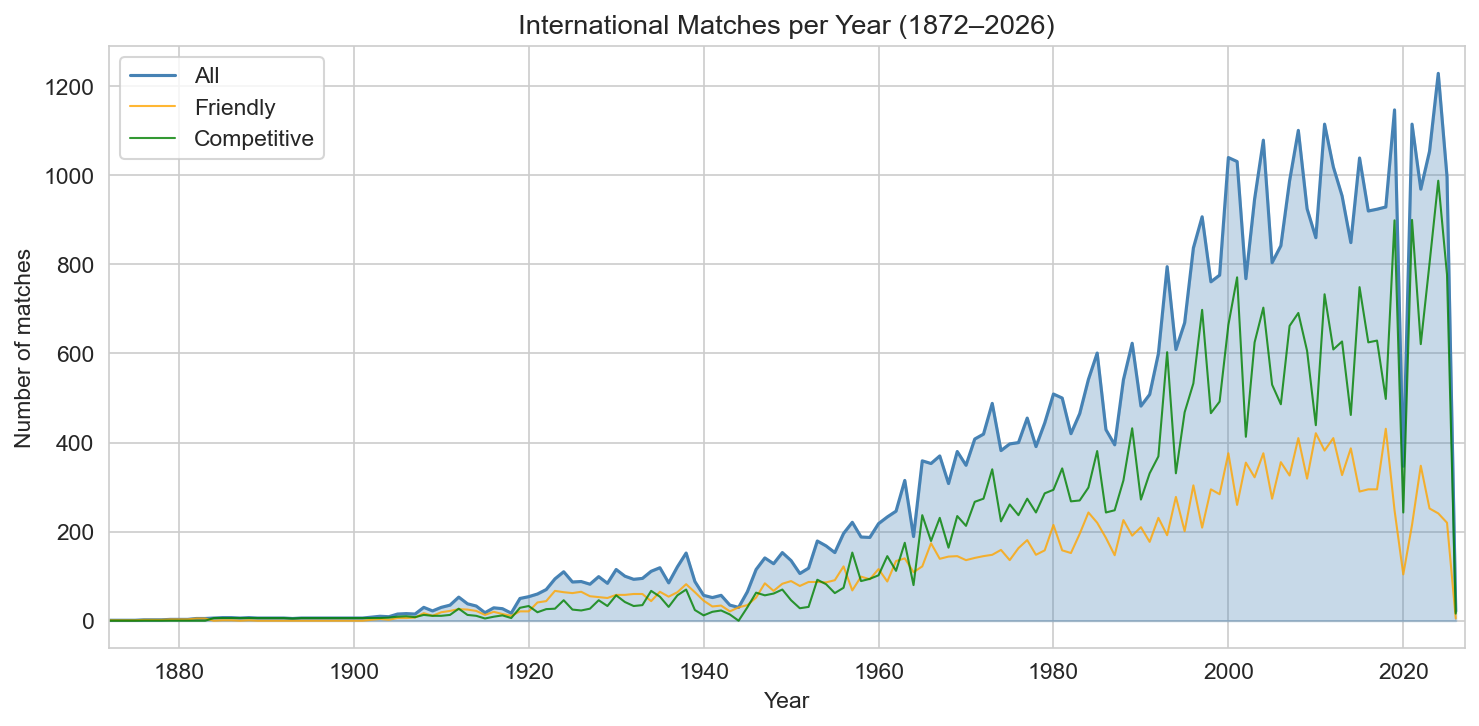
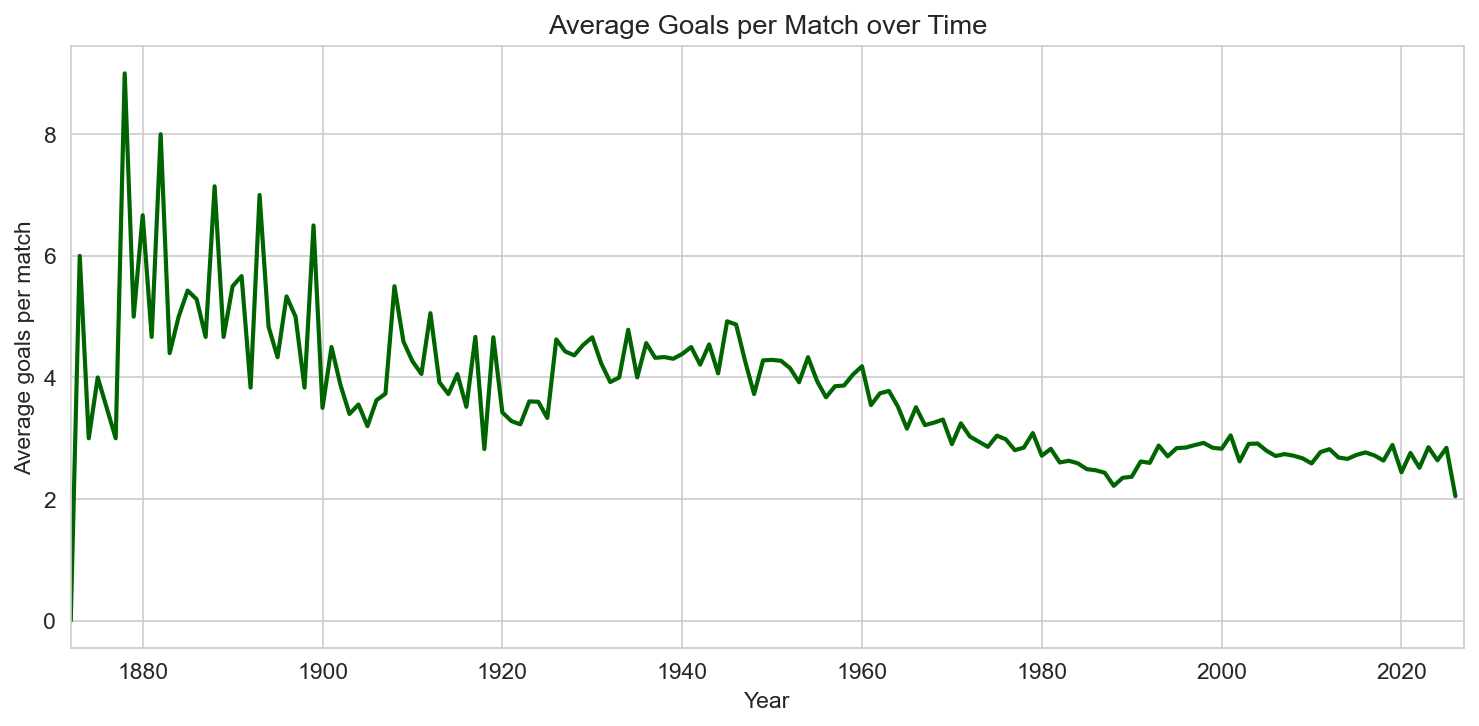
In this dataset, 49,071 matches are recorded from 1872 to 2026. The median total goals per match is 3 and the mean is about 2.94; the draw rate is 22.7%. Match volume grows sharply from the late twentieth century onward, with friendlies and competitive fixtures (World Cup qualifiers, continental cups, and regional tournaments) both contributing. Goals per match and draw rate vary by era and tournament type; the visualizations below capture these trends.
- Match volume: Matches per year rise from a handful in the 1870s to well over a thousand in recent years; the split between friendly and competitive matches shows how the international calendar has expanded.
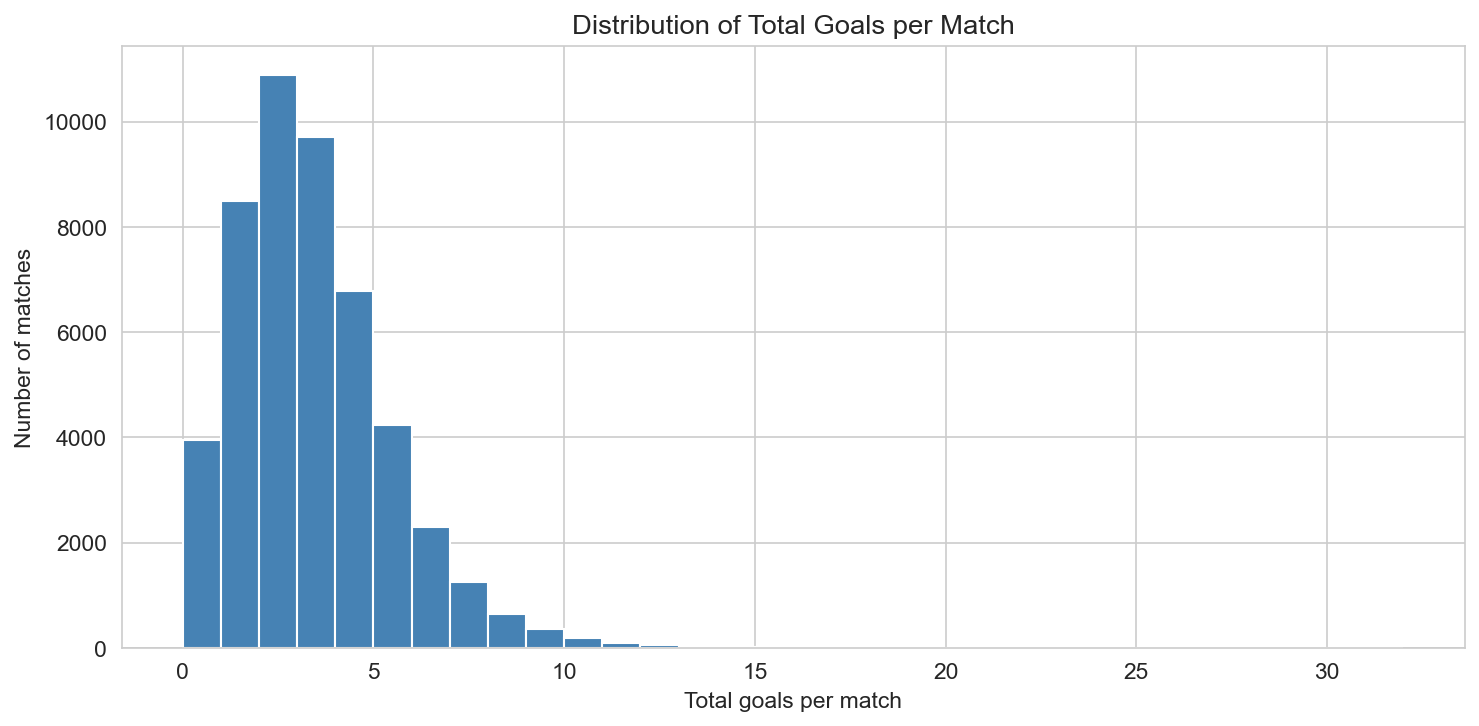
- Score distribution: The histogram of total goals per match shows a familiar shape—most games sit in the two- to four-goal range, with a long tail of high-scoring games.
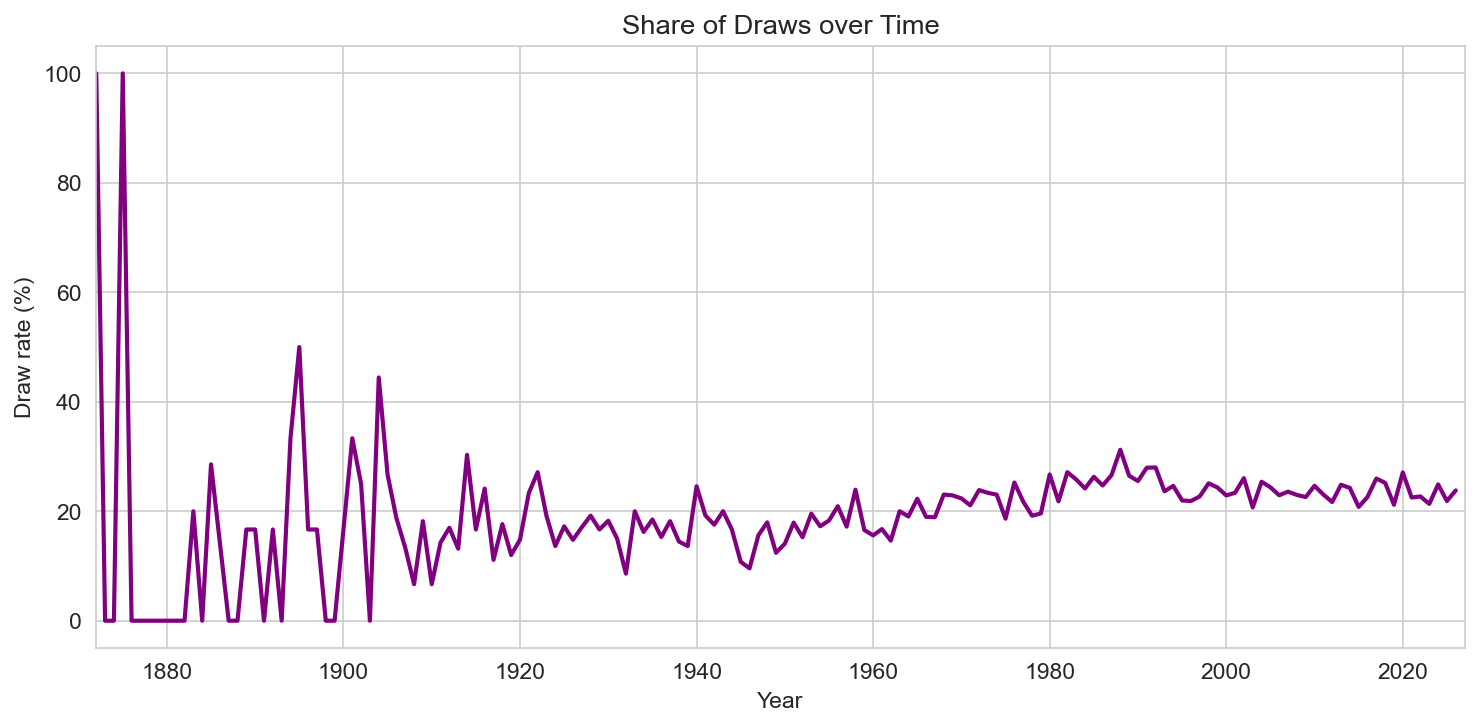
- Draw rate over time: The share of draws fluctuates by decade and by competition mix; the time series highlights when draws became more or less common.
Home advantage and neutral venues
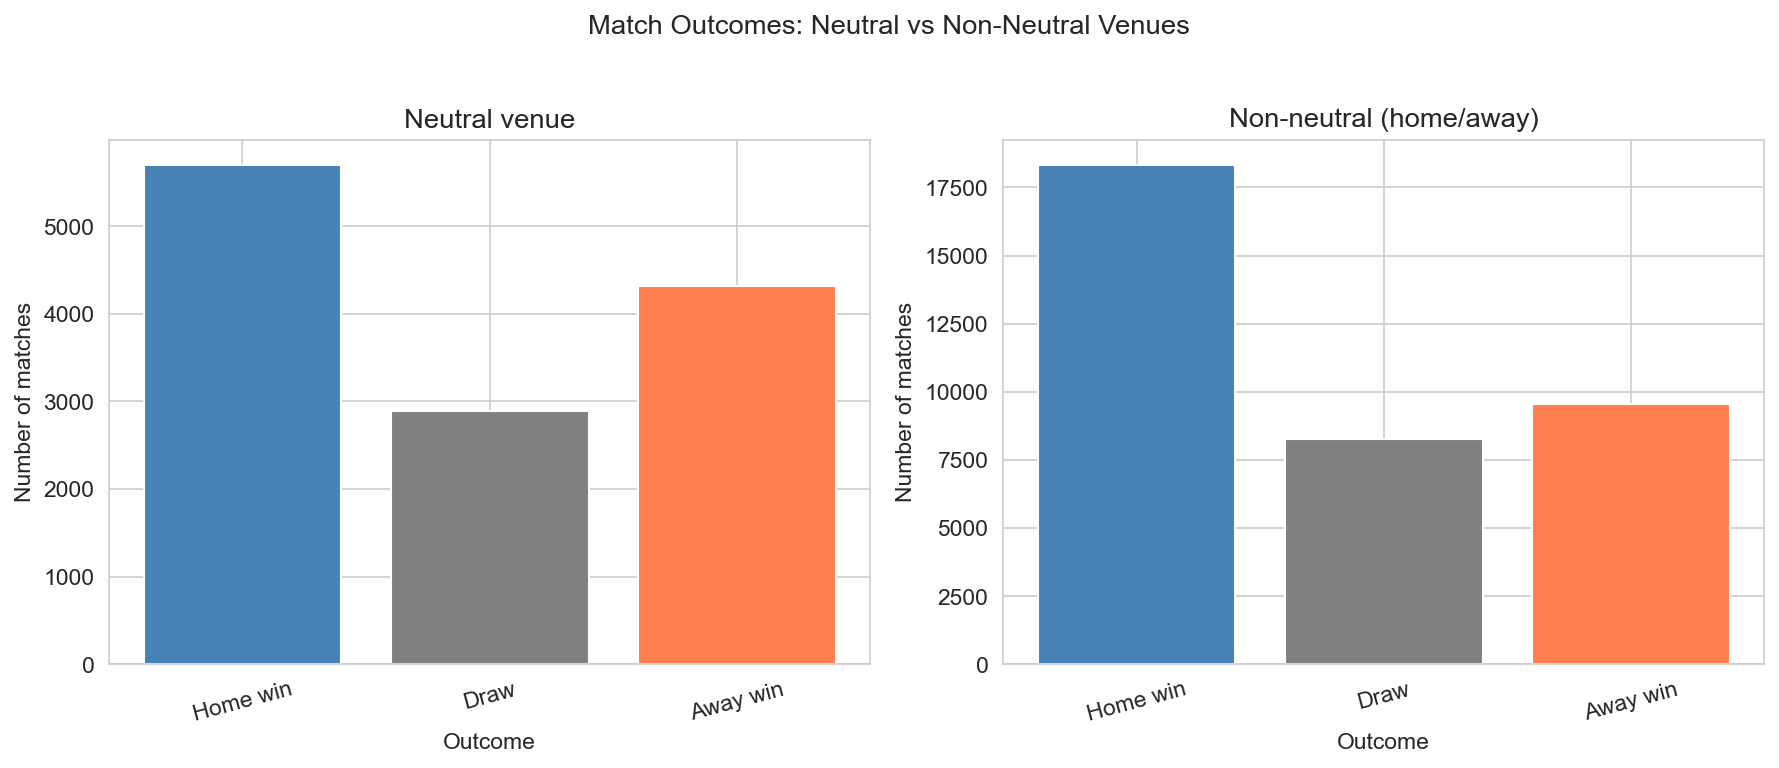
When matches are played on neutral ground, the “home” and “away” labels are purely notional—there is no crowd or travel advantage for either side. When they are not neutral, the home team typically enjoys a real home advantage. Comparing outcomes in neutral vs non-neutral venues shows a clear pattern: in non-neutral matches, home wins dominate; in neutral matches, the split between home win, draw, and away win is more even. The bar chart makes this contrast explicit and supports the widely held view that venue matters.
Teams: who plays most and who wins
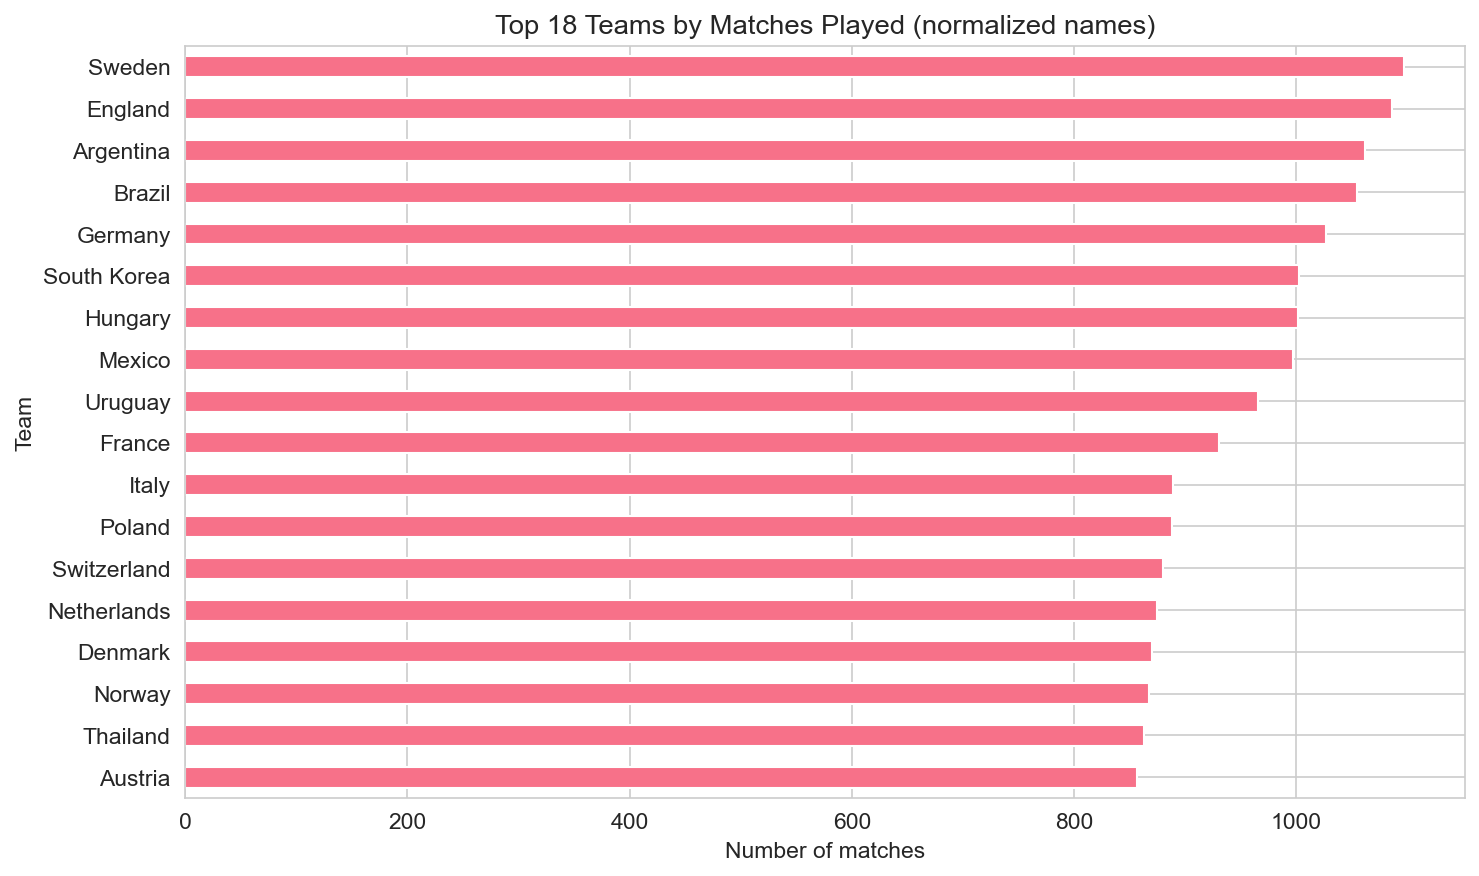
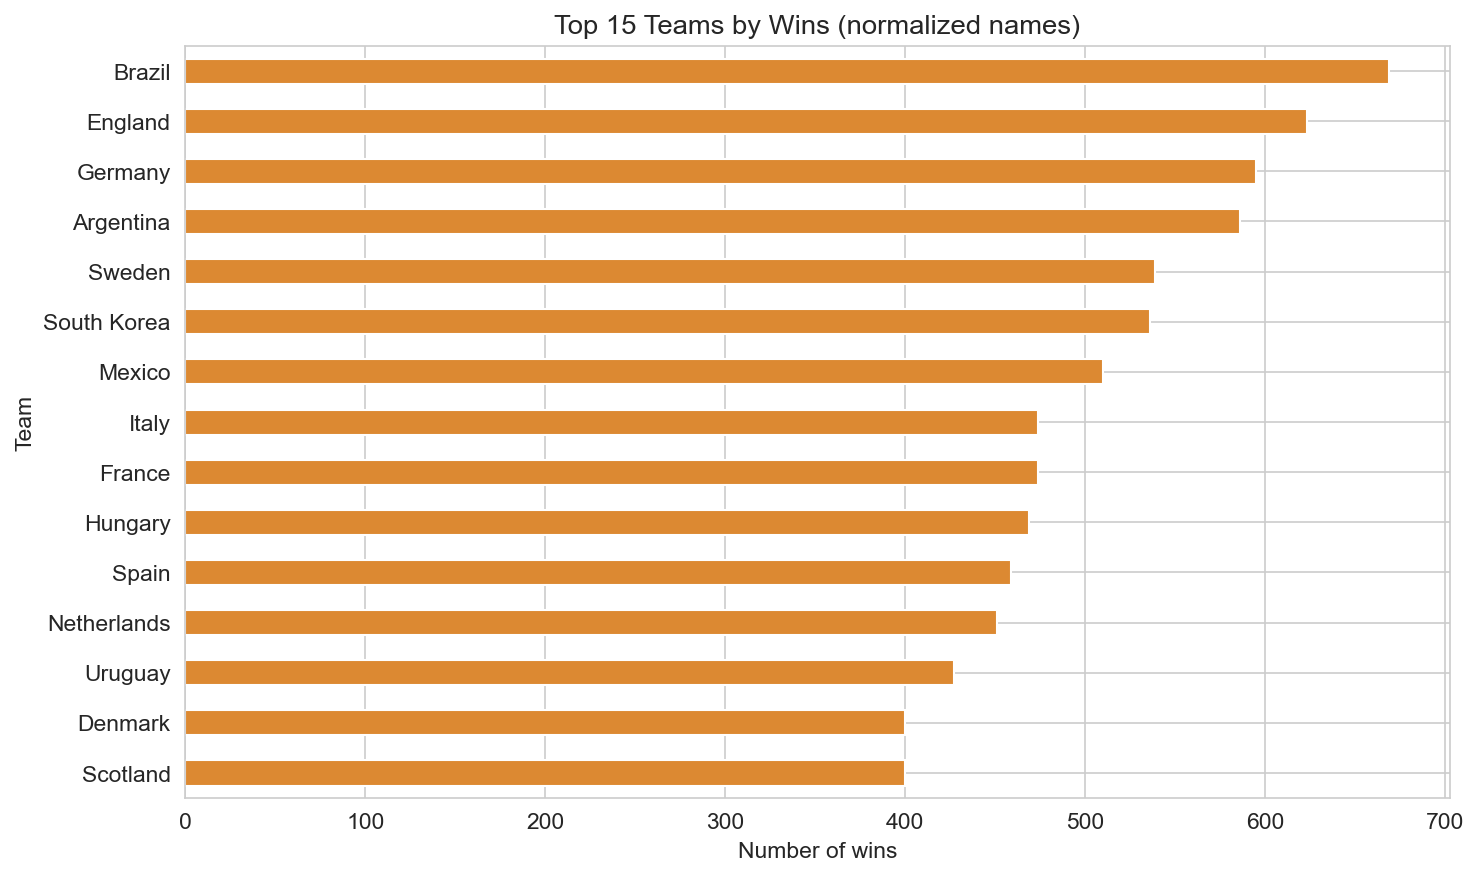
Using historical country names in the dataset to group teams across eras (e.g. Soviet Union and CIS with Russia, West Germany with Germany where applicable), we count each team’s matches played (home and away) and wins. The top teams by matches are those with long histories and busy fixture lists—Brazil, Sweden, Argentina, and others. The top teams by wins overlap strongly but order differently, reflecting win rate as well as volume. Together these give a consistent view of international football history under current country names.
Tournaments and where the world plays
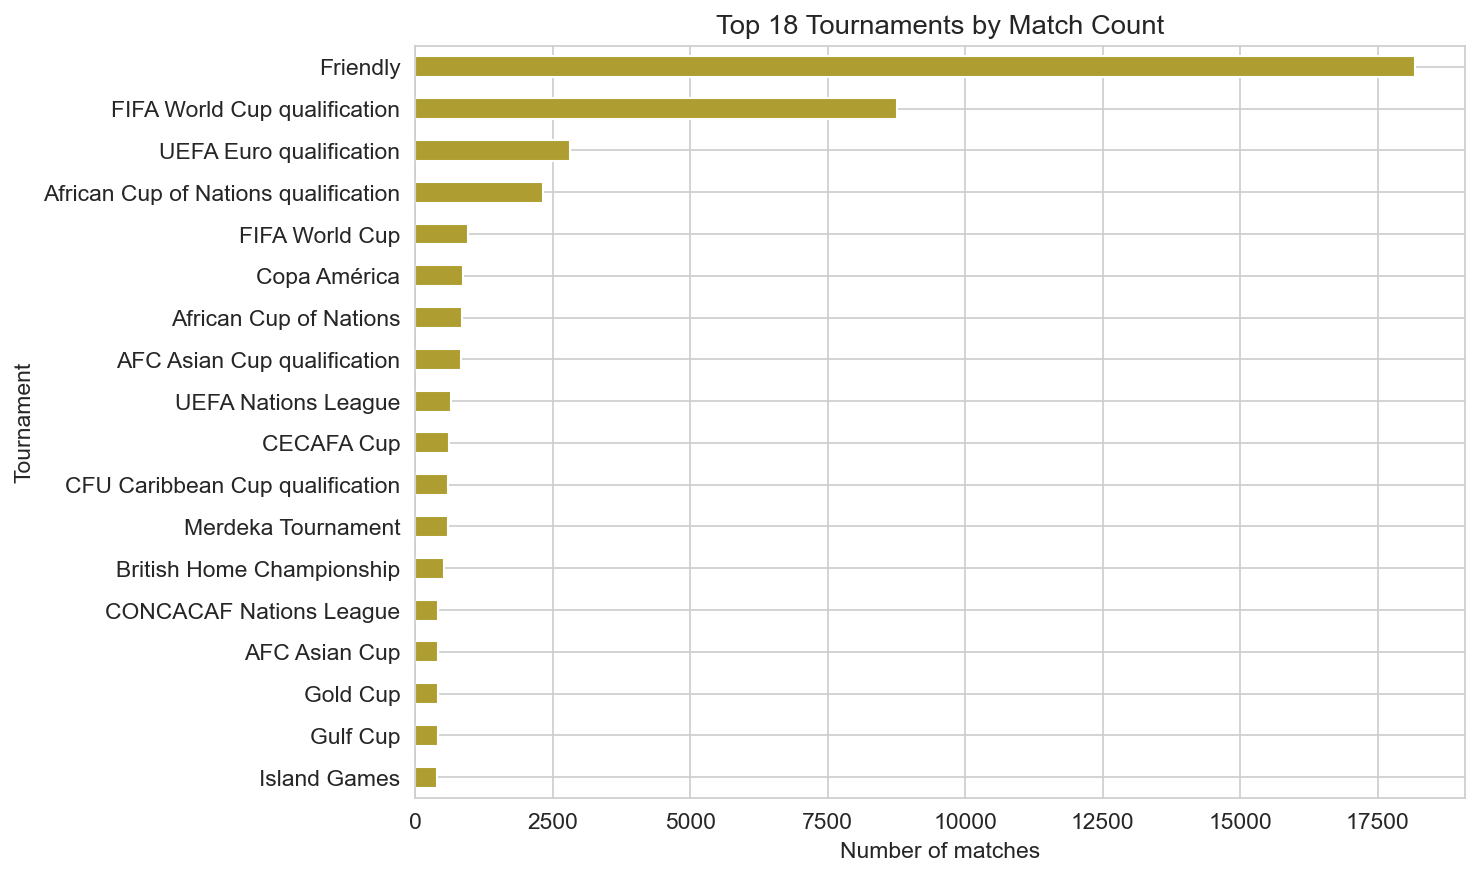
Tournament mix: Friendlies account for the largest number of matches in the dataset, followed by FIFA World Cup qualification, UEFA Euro qualification, African Cup of Nations qualification, the FIFA World Cup finals, Copa América, and many regional competitions. The horizontal bar chart of the top 18 tournaments by match count shows how qualification and continental cups dominate the calendar alongside friendlies.
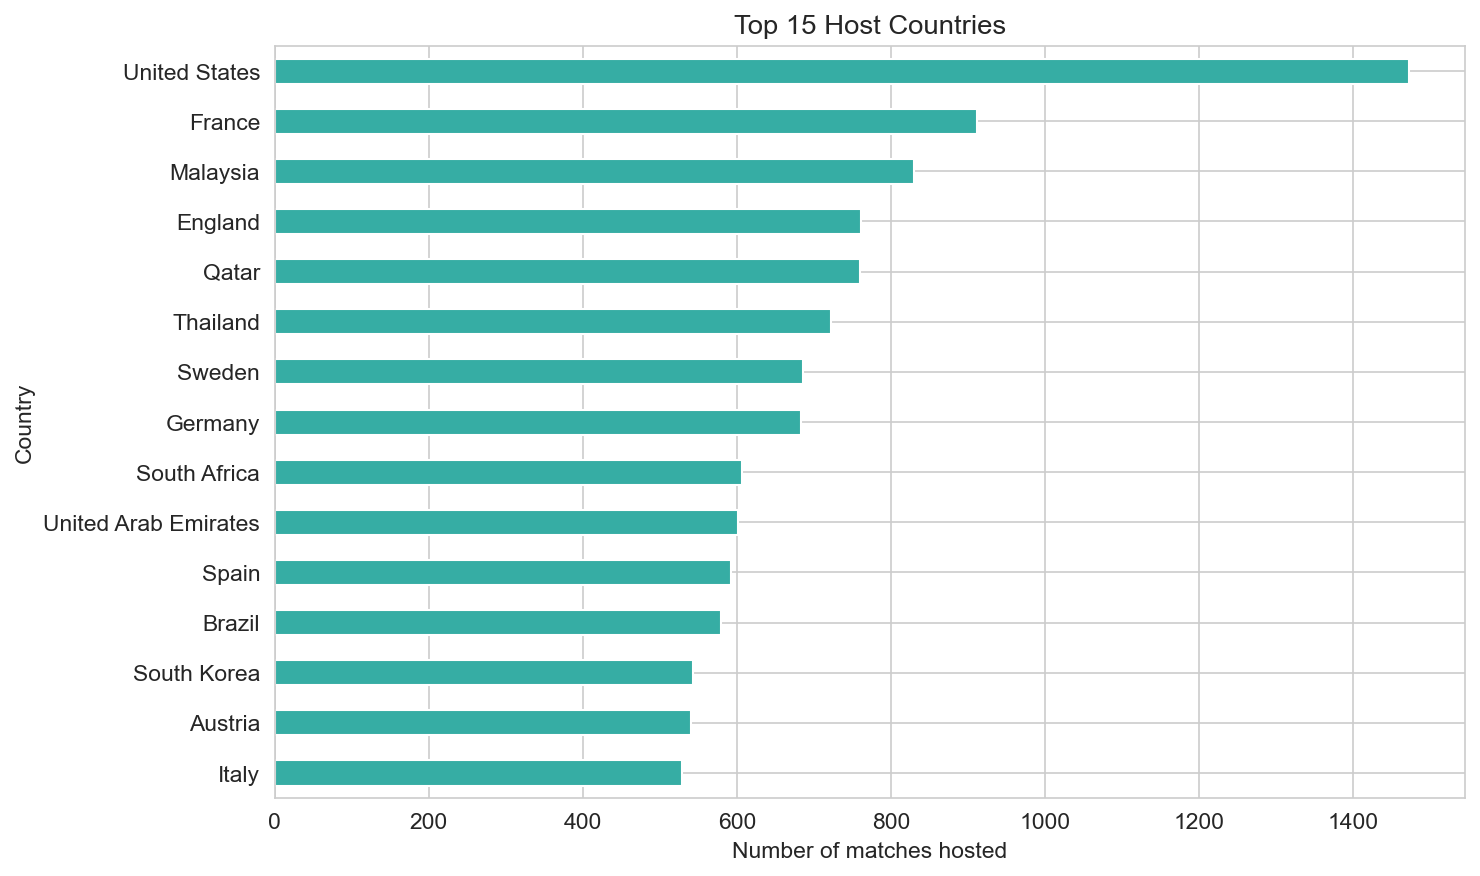
Host geography: The top 15 host countries by number of matches hosted reflect where international football is most often played—a mix of European, South American, and other confederations. This complements the tournament view by showing where the sport is staged, not only which competition is being played.
Goals and goalscorers
The goalscorer data links each goal to a match and records who scored, in which minute, and whether it was a penalty or an own goal. We use 47,507 goals with a known scorer for the analysis below.
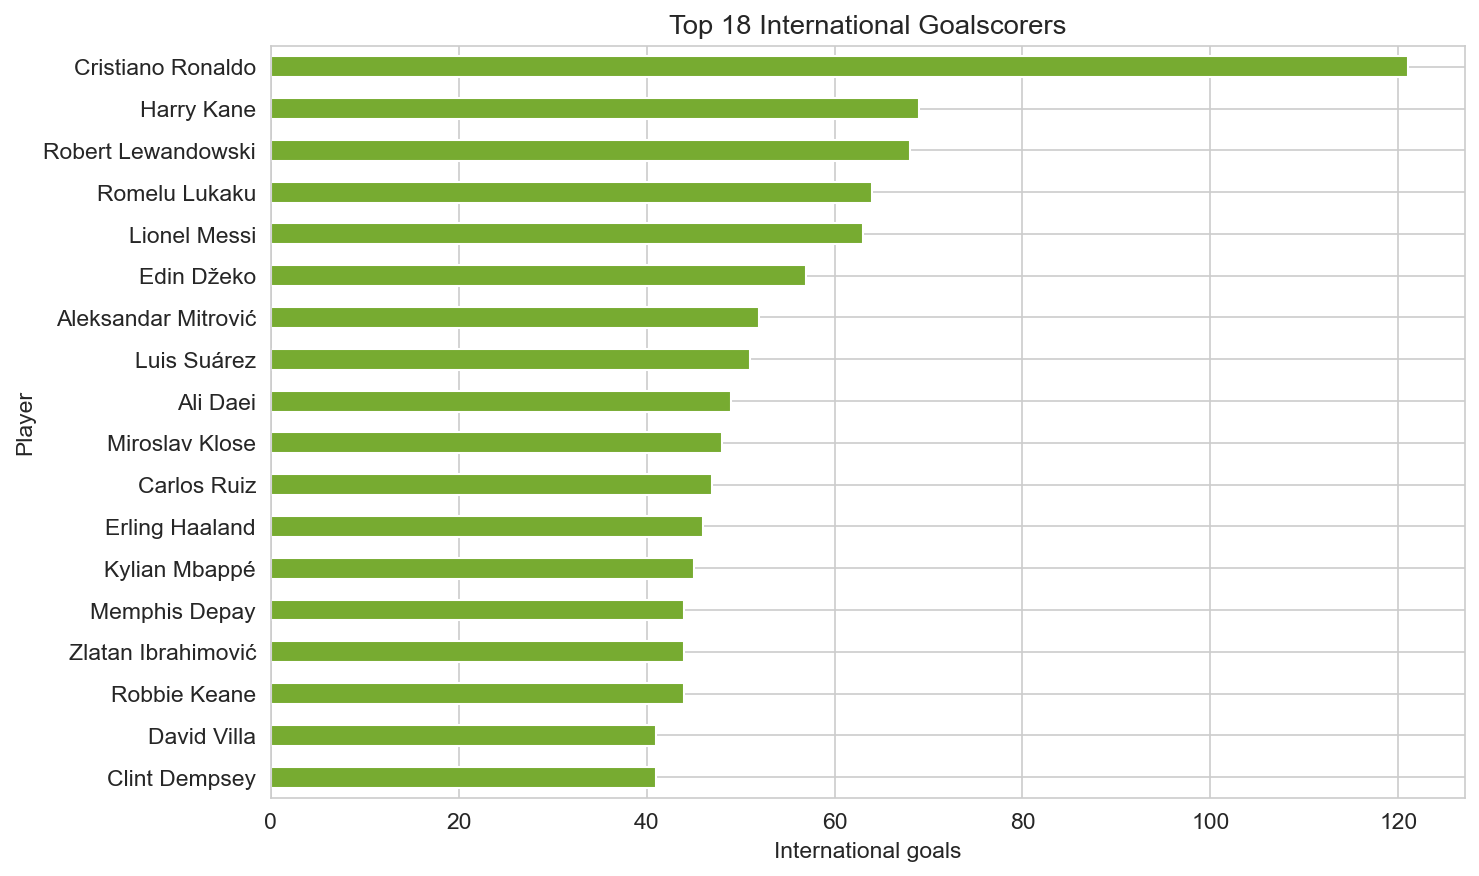
Top scorers: Cristiano Ronaldo, Harry Kane, Robert Lewandowski, Romelu Lukaku, Lionel Messi, and other modern stars sit at the top of the international goals list. The horizontal bar chart shows the top 18; the dataset’s coverage is strongest from the twentieth century onward, so historical figures appear alongside current ones where data exists.
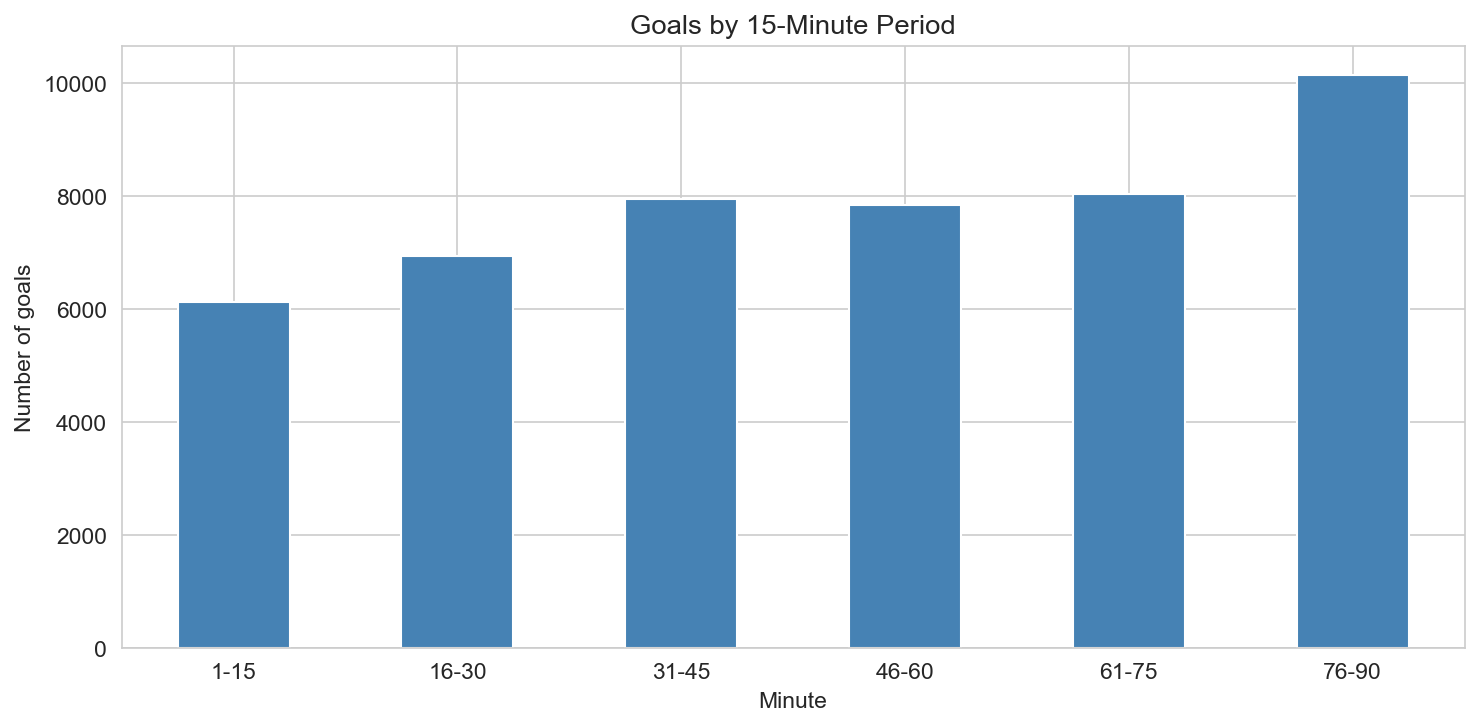
Goal timing: Goals by 15-minute period (1–15, 16–30, …) show more goals in the second half than the first in aggregate, with a peak in the final 15 minutes—consistent with fatigue, substitutes, and risk-taking when trailing.
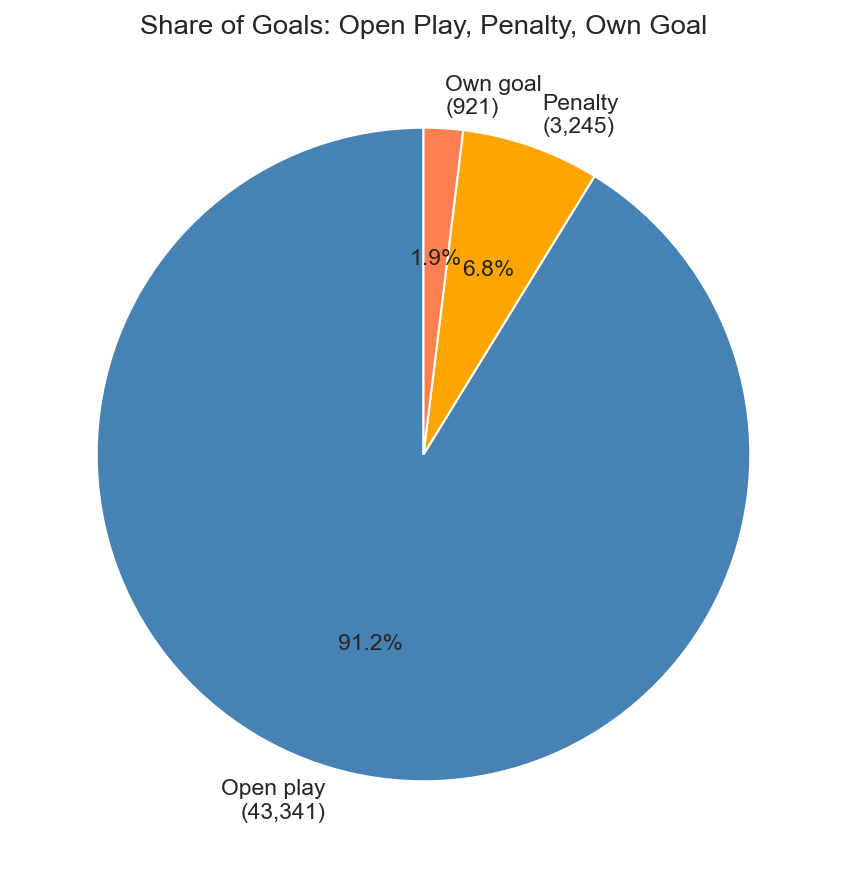
Penalties and own goals: In this dataset, 6.8% of goals are penalties and 1.9% are own goals; the rest are open-play goals. The pie chart summarises these shares and underlines that the majority of goals are from open play.
Penalty shootouts
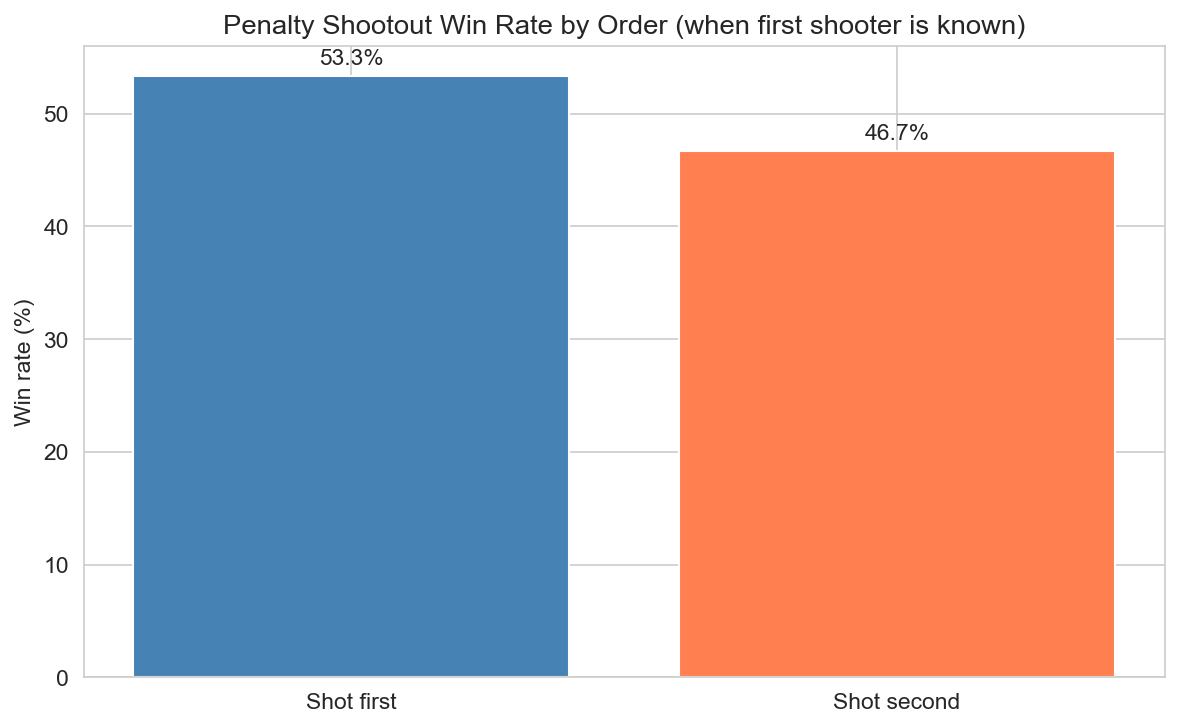
First-shooter advantage: When a penalty shootout goes to sudden death, the order of shooting can be contested. For the 240 shootouts in the dataset where who shot first is recorded, the team that shot first won 53.3% of the time—a modest but real advantage. The chart below compares win rate when shooting first vs second.
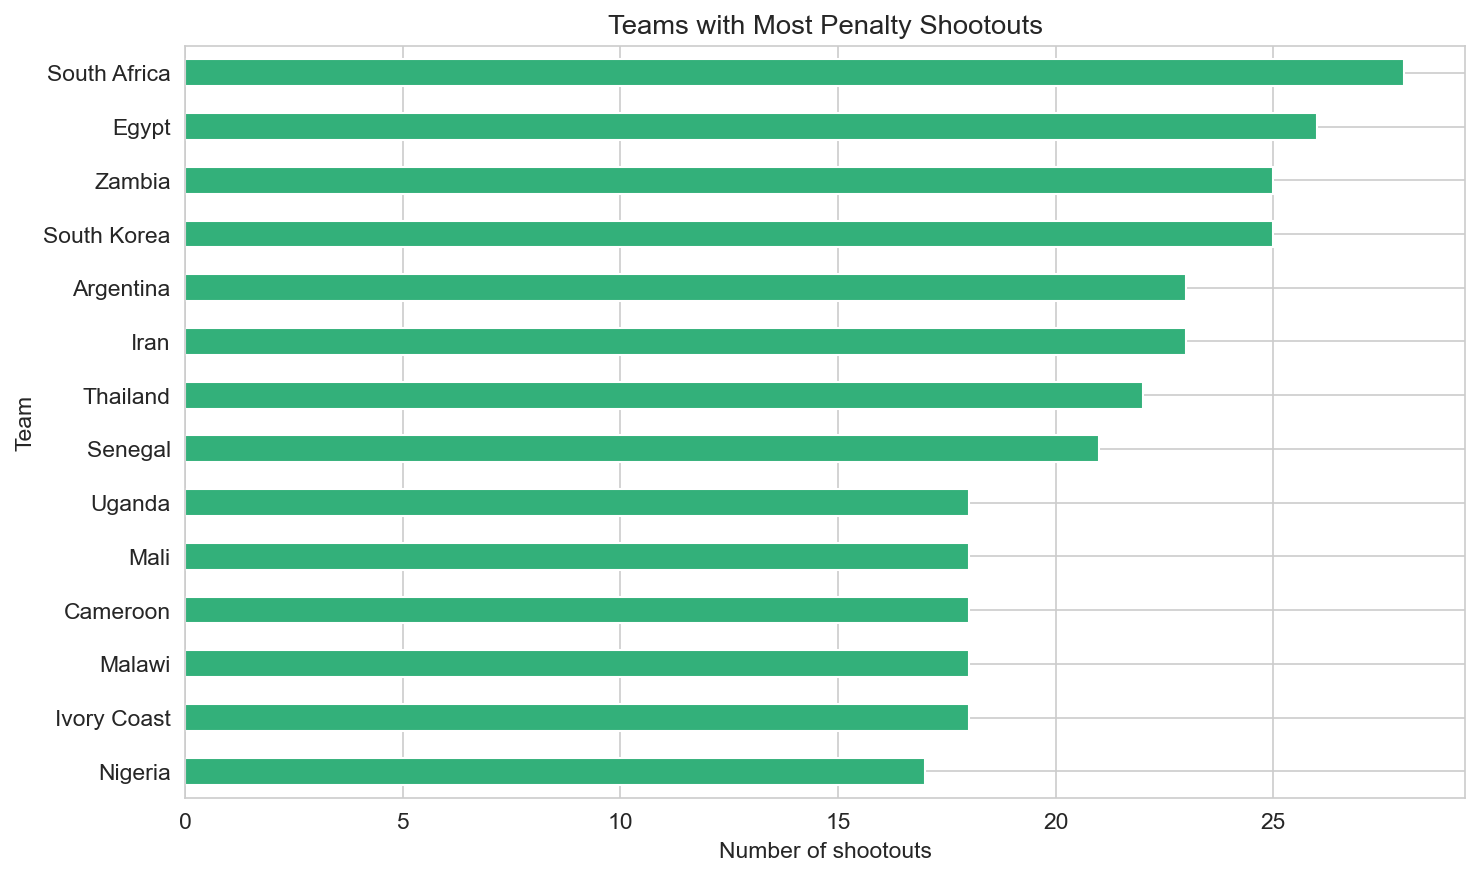
Teams in shootouts: Which teams have been involved in the most penalty shootouts? The chart of shootout appearances (as home or away) highlights nations that have frequently reached knockout stages or played in competitions that use shootouts to decide drawn games. Win rates in shootouts can be derived from the same data for further analysis.
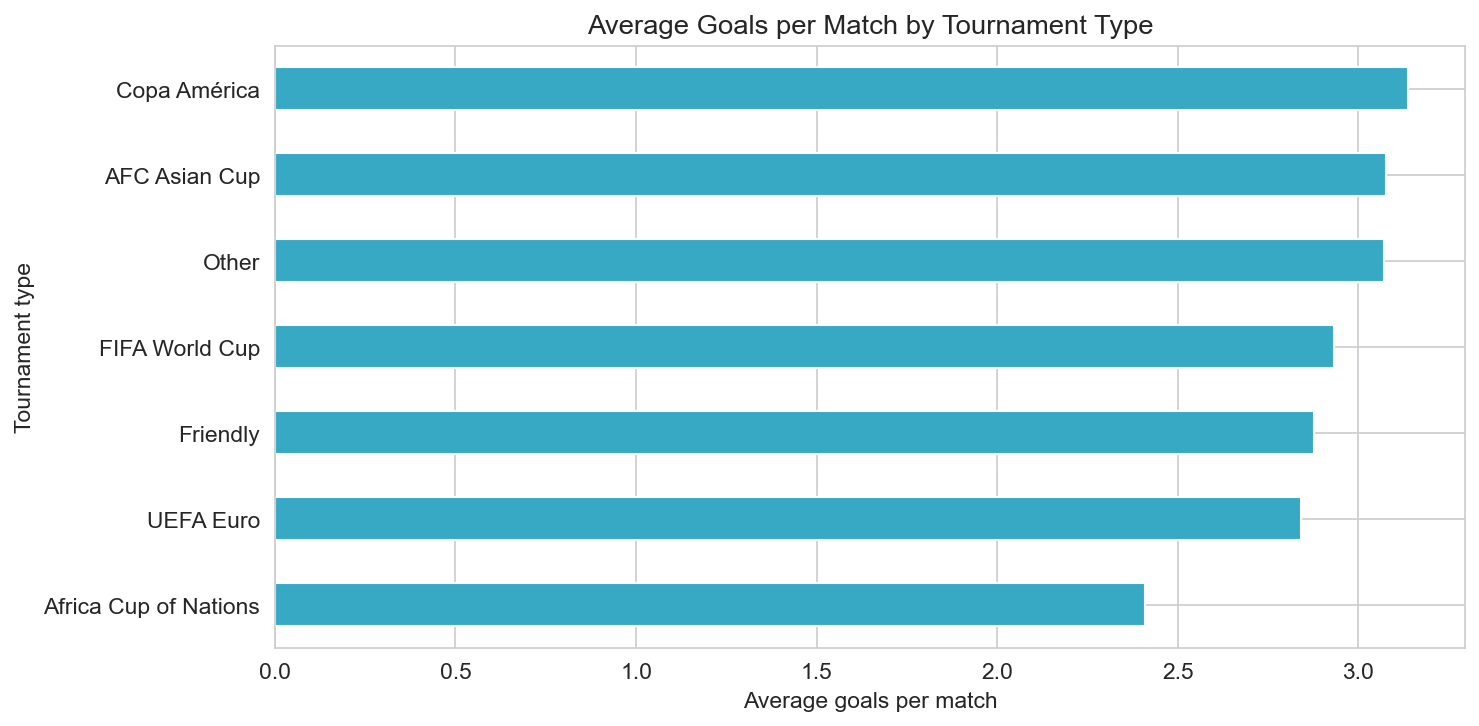
Goals per match by tournament type
Grouping tournaments into broad types (Friendly, FIFA World Cup, UEFA Euro, Copa América, Africa Cup of Nations, AFC Asian Cup, Other) and taking the average goals per match in each gives a simple comparison. Some competition types produce slightly more or fewer goals on average; the chart shows these differences and helps put “goals per match” in context by tournament category.
Practical takeaways
- The data spans 1872–2026 and 49,071 matches; the time-series charts show how match volume and goals per match have changed over time.
- Draw rate is about 23% overall; home advantage is clear when games are not on neutral ground. Top teams and top scorers are grouped under current country names (e.g. Russia includes Soviet Union and CIS) for a consistent historical view.
- Shooting first in a penalty shootout is associated with a ~53% win rate when the order is known—a small but meaningful edge.
Conclusion
The international football data paints a clear picture: match volume has grown enormously over 150 years, with a median of three goals per match and a draw rate around 23%. Home advantage is strong in non-neutral games; at neutral venues outcomes are more balanced. Top teams by matches and wins align with football history when country names are grouped across eras; top goalscorers are dominated by modern stars where coverage is strongest. Goals are mostly from open play, with about 7% penalties and 2% own goals. In penalty shootouts, shooting first carries a modest advantage (about 53% win rate when order is known). Together, the data offers a clear, visual picture of how international football has been played and decided.
Data and methodology
- Source: All data and charts in this post come from International football results from 1872 to 2017 by martj42 on Kaggle (the dataset may be updated through 2026). It is also available on GitHub under CC0-1.0.
- What we used: Match results (teams, scores, tournament, venue, neutral or not), goalscorer records (player, minute, penalty, own goal), penalty shootout outcomes (winner and who shot first when available), and historical country names to group teams across name changes (e.g. Soviet Union and CIS with Russia).
- How we treated the data: We excluded matches with missing scores and goals without a known scorer. For team rankings we grouped historical names with current ones (e.g. Soviet Union → Russia) so each country has one consistent history. The first-shooter advantage uses the 240 shootouts where who shot first is recorded; we measured how often that team won.
- Charts: All figures were generated from this dataset; no other data was added.


