

What can over a decade of 15-minute electricity data tell us about Germany’s power system—how load varies by hour and season, how the generation mix shifted from fossil and nuclear to renewables, and how cross-border flows and forecasts behave? This post uses the German Power Consumption dataset by samithsachidanandan on Kaggle to explore load distributions and seasonality, the changing generation mix from 2015 to 2026, the rise of wind and solar, the nuclear phase-out in April 2023, imports and exports by border, and how wind+solar forecasts compare to actual generation. The result is a data-driven snapshot of Germany’s electricity system over the energy transition.
Data overview
The dataset contains about 380,600 rows of 15-minute resolution data from January 2015 to March 2026. Each row includes actual load (MW), wind and solar forecasts (day-ahead and intraday), actual generation by source (biomass, fossil fuels, geothermal, hydro, nuclear, solar, waste, wind onshore and offshore, and others), and net imports by border (e.g. CH, CZ, DK, FR, NL, PL, SE, SI, BE, AT, NO). Only generation columns marked Actual Aggregated were used for supply totals to avoid double-counting; missing values in sparse columns (e.g. geothermal) were treated as zero for aggregation. The first column is the datetime index (timezone-aware); load and generation are in MW.
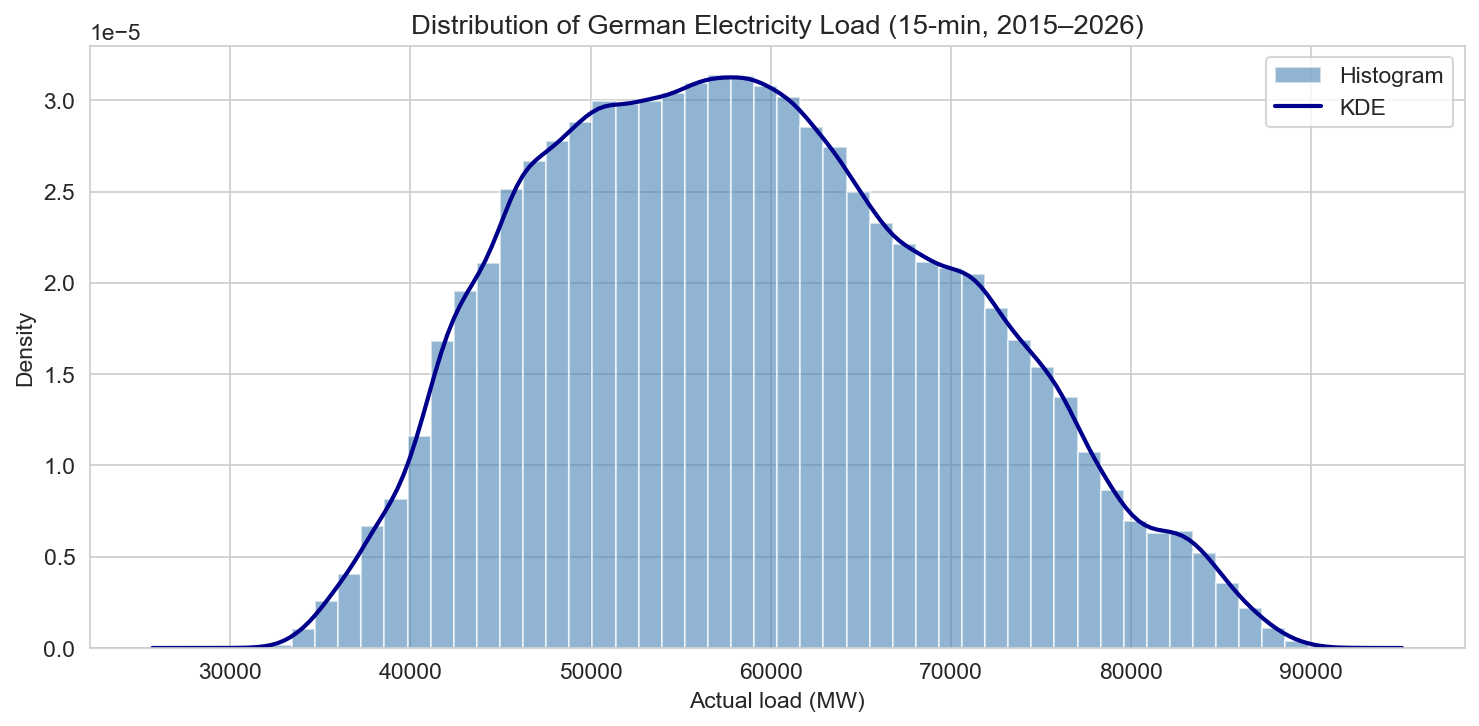
- Load: minimum about 28,308 MW, maximum 92,418 MW, mean about 58,796 MW. The distribution is roughly bell-shaped with a long right tail during cold, dark peaks.
- Generation sources: Wind (onshore and offshore), solar, biomass, hydro (run-of-river, reservoir, pumped storage), nuclear, fossil (brown coal/lignite, hard coal, gas, oil, coal-derived gas), waste, geothermal, and other. Generation is summed per 15-minute interval and then resampled to daily or monthly for trend plots.
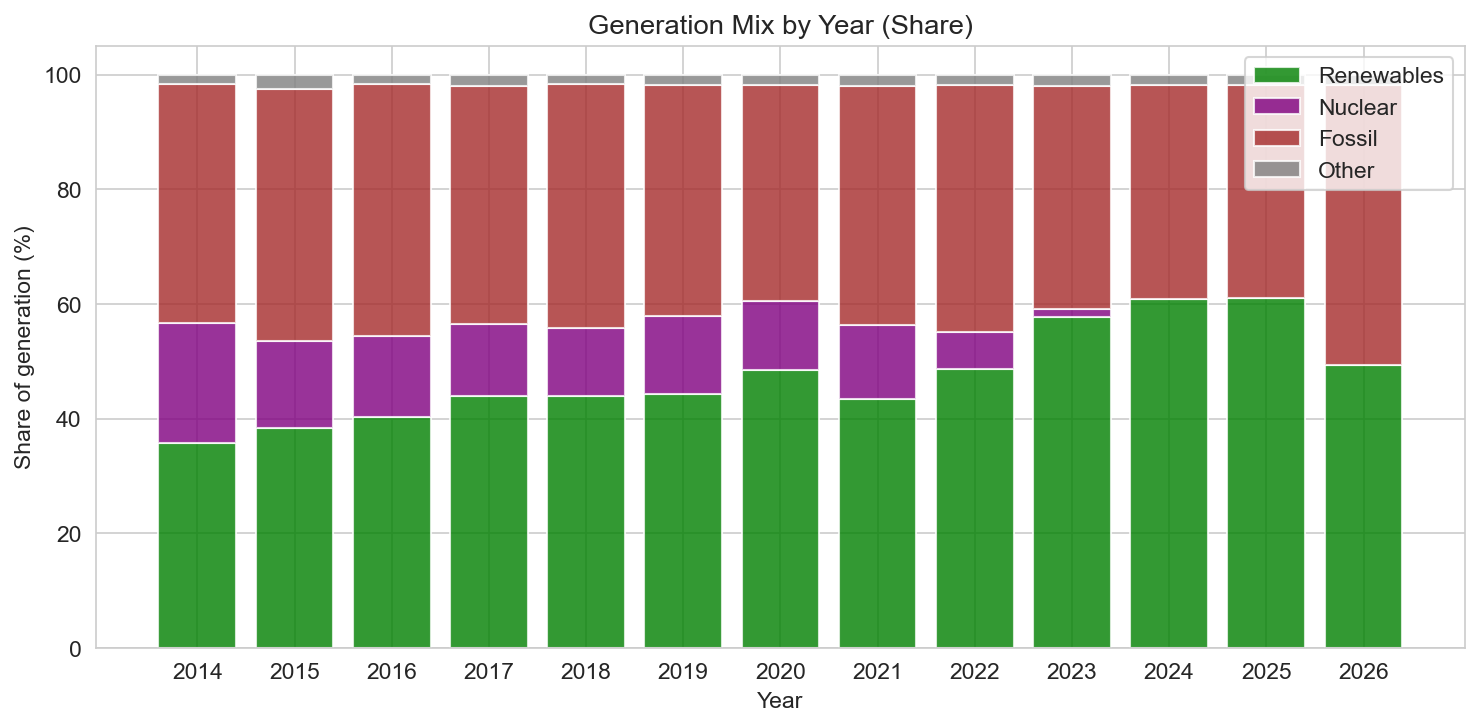
- Renewables share: In the first full year in the data, renewables accounted for about 36% of generation; by the last full year this share had risen to about 49%.
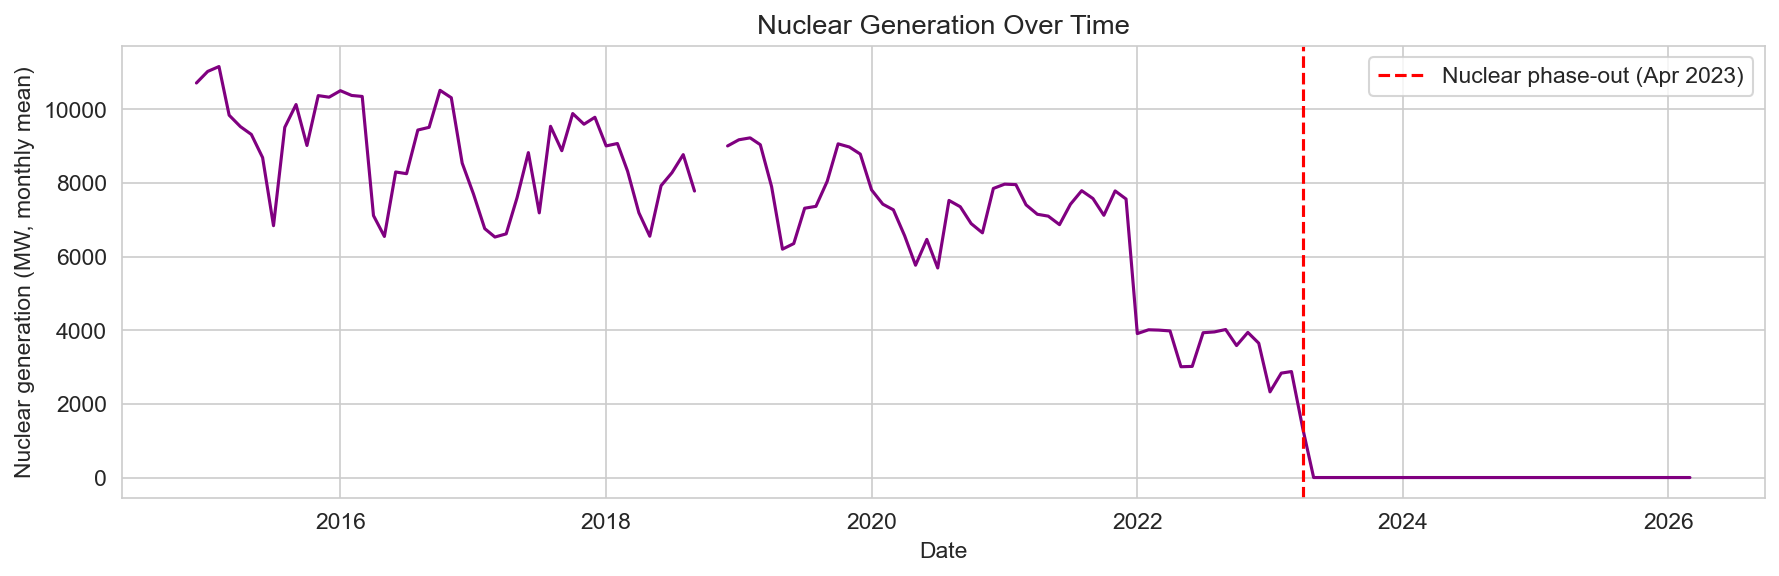
- Nuclear: Average nuclear output was about 7,503 MW before April 2023 and about 38 MW after the phase-out, reflecting the shutdown of the last German nuclear plants.
Load patterns
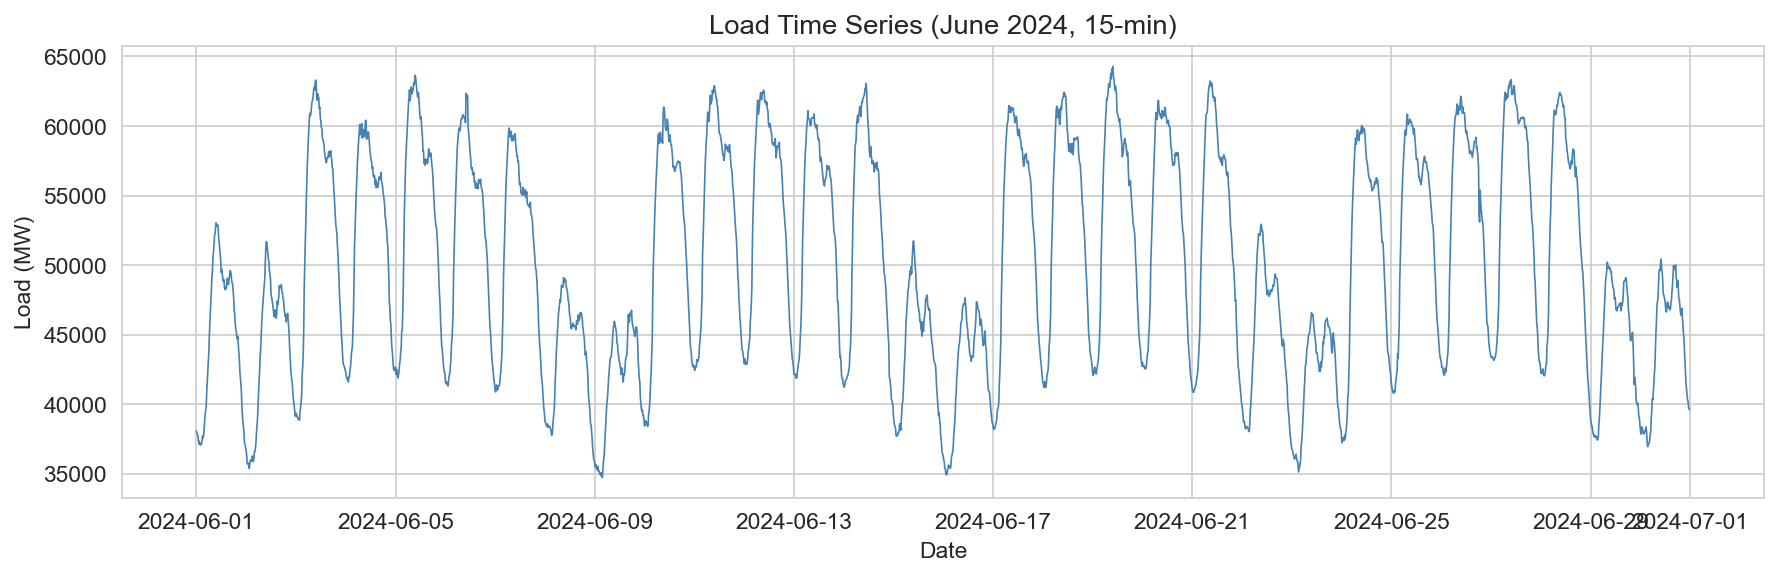
The load distribution (first figure) shows that most of the time German load sits between roughly 50,000 and 70,000 MW, with a peak near 60,000 MW and a long tail toward 90,000 MW during winter or high-demand periods. The time series sample (second figure) for June 2024 illustrates the typical intraday pattern: load rises in the morning, plateaus during the day, and falls at night, with a slight midday dip when solar generation is high.
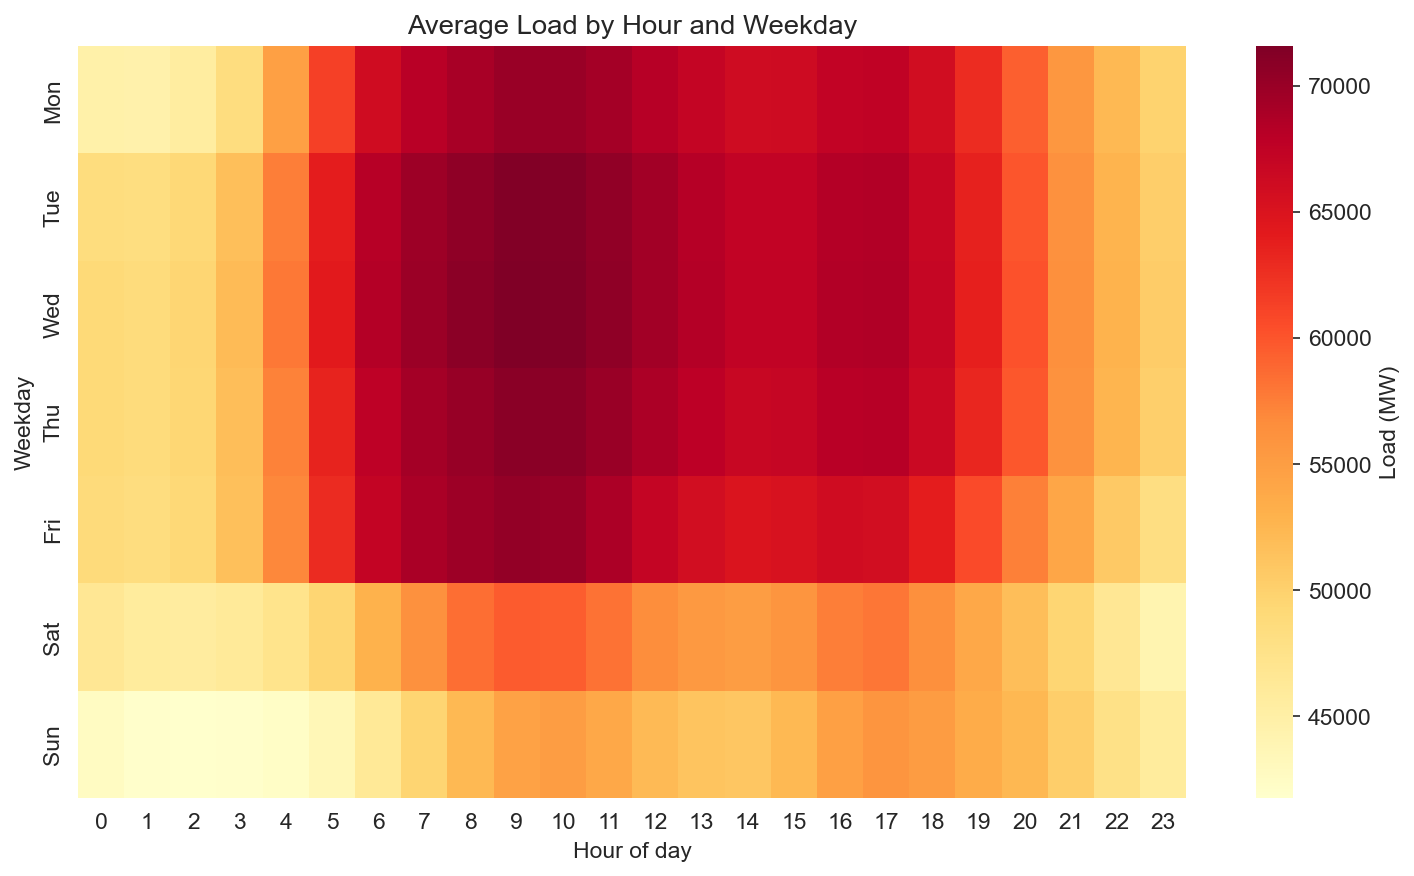
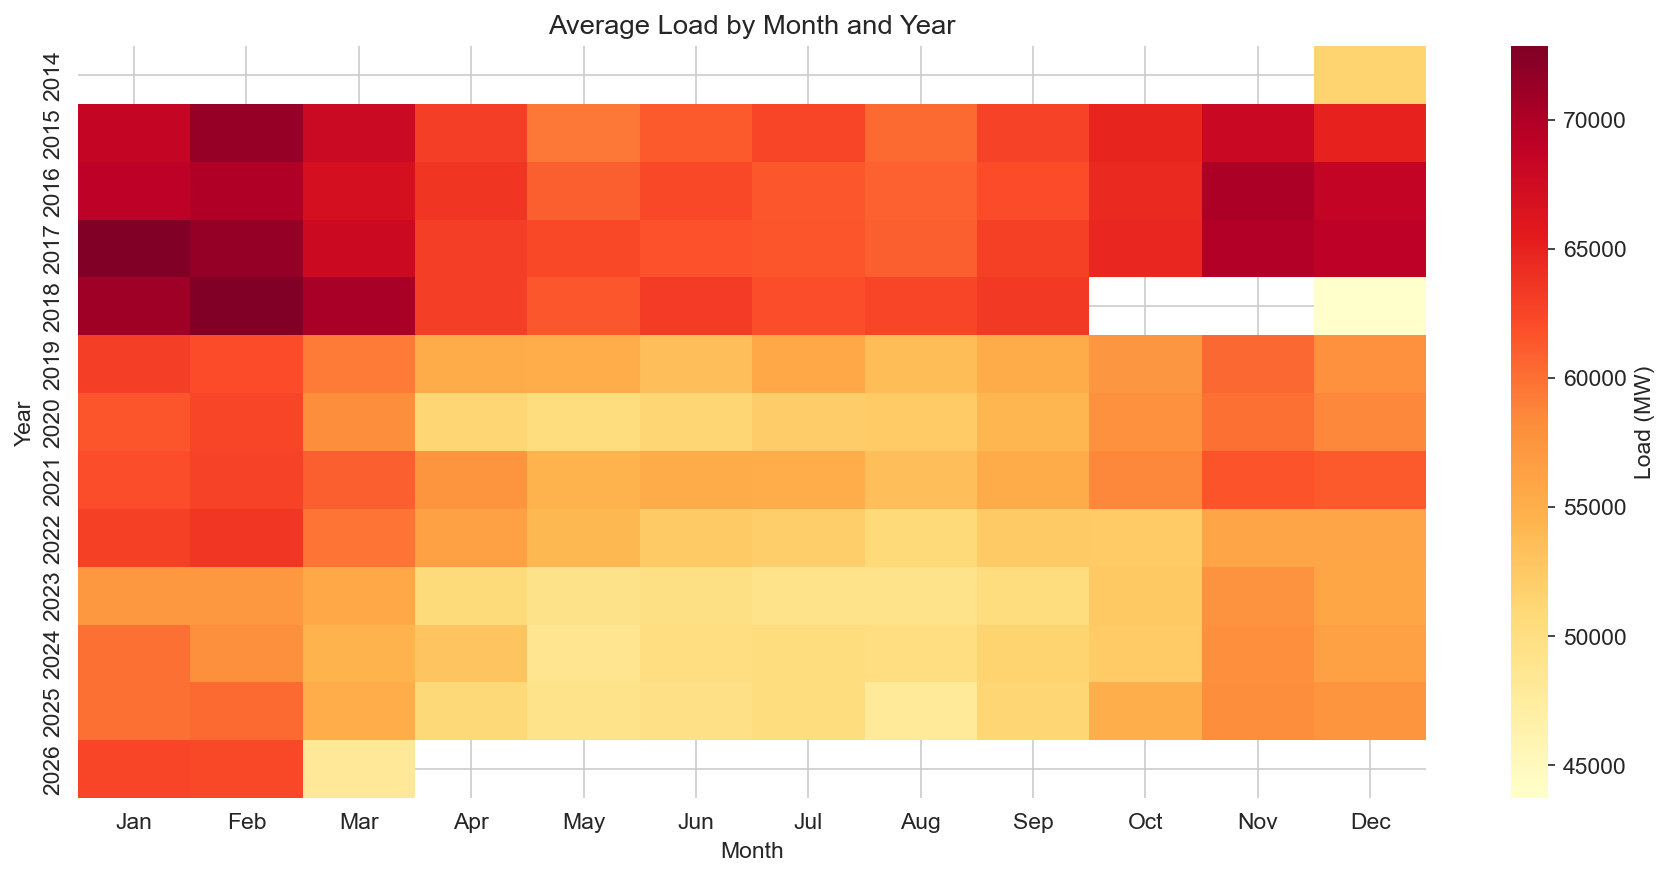
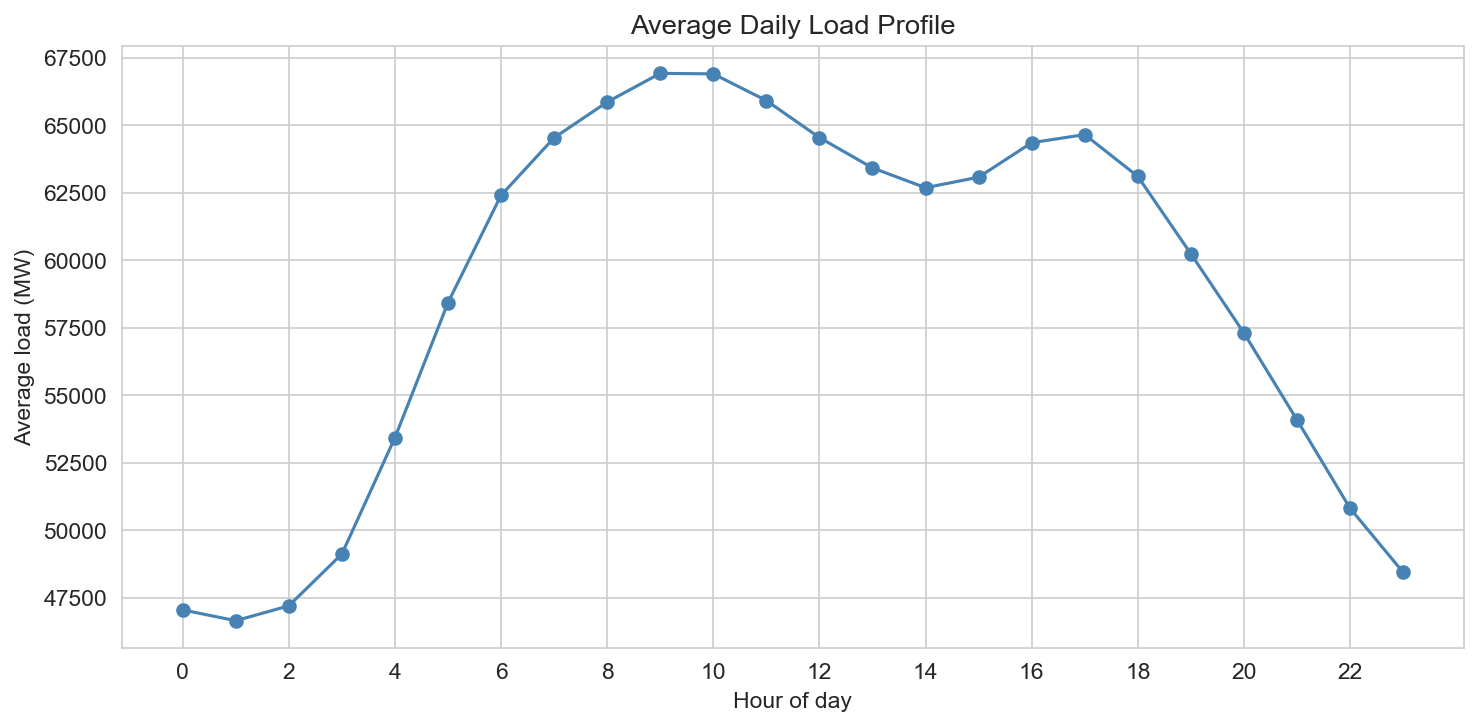
The heatmap of load by hour and weekday (third figure) makes the structure clear: weekdays have a strong morning ramp and an evening peak; weekends show a flatter profile and slightly lower levels. The month-by-year heatmap (figure 12) shows both seasonality (higher load in winter, lower in summer) and a long-term trend—average load has remained in a similar band over the years, with some year-to-year variation. The average daily load profile (figure 13) summarizes the typical hour-by-hour shape: a trough in the early morning and a broad plateau during daytime and early evening.
Generation mix and the energy transition
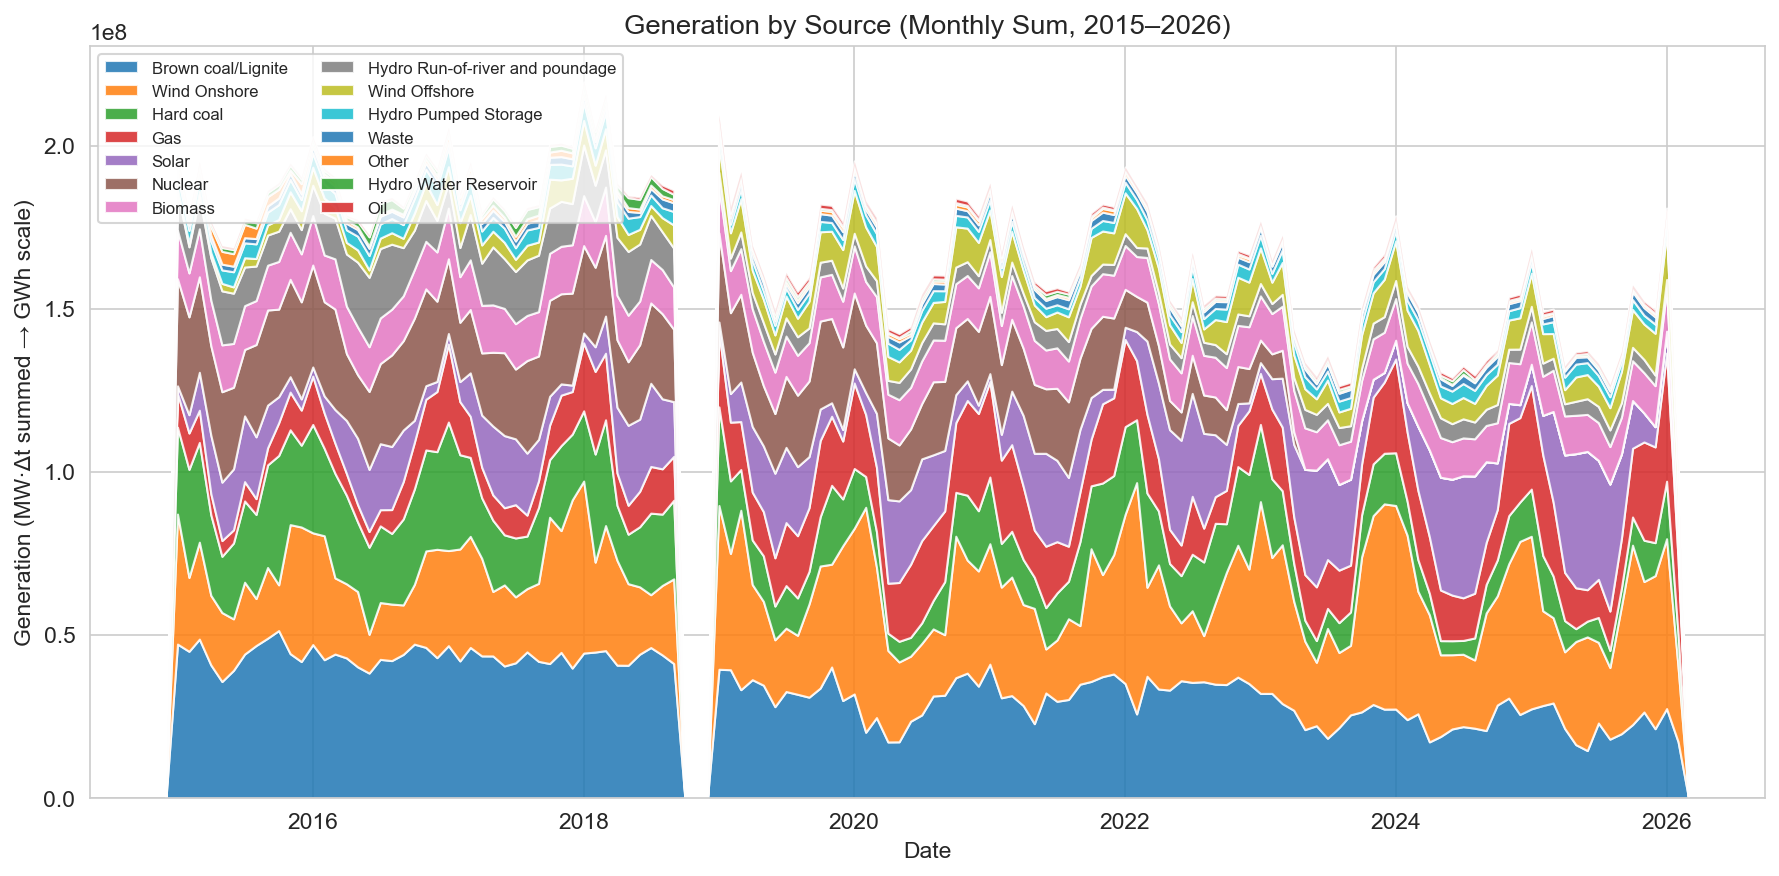
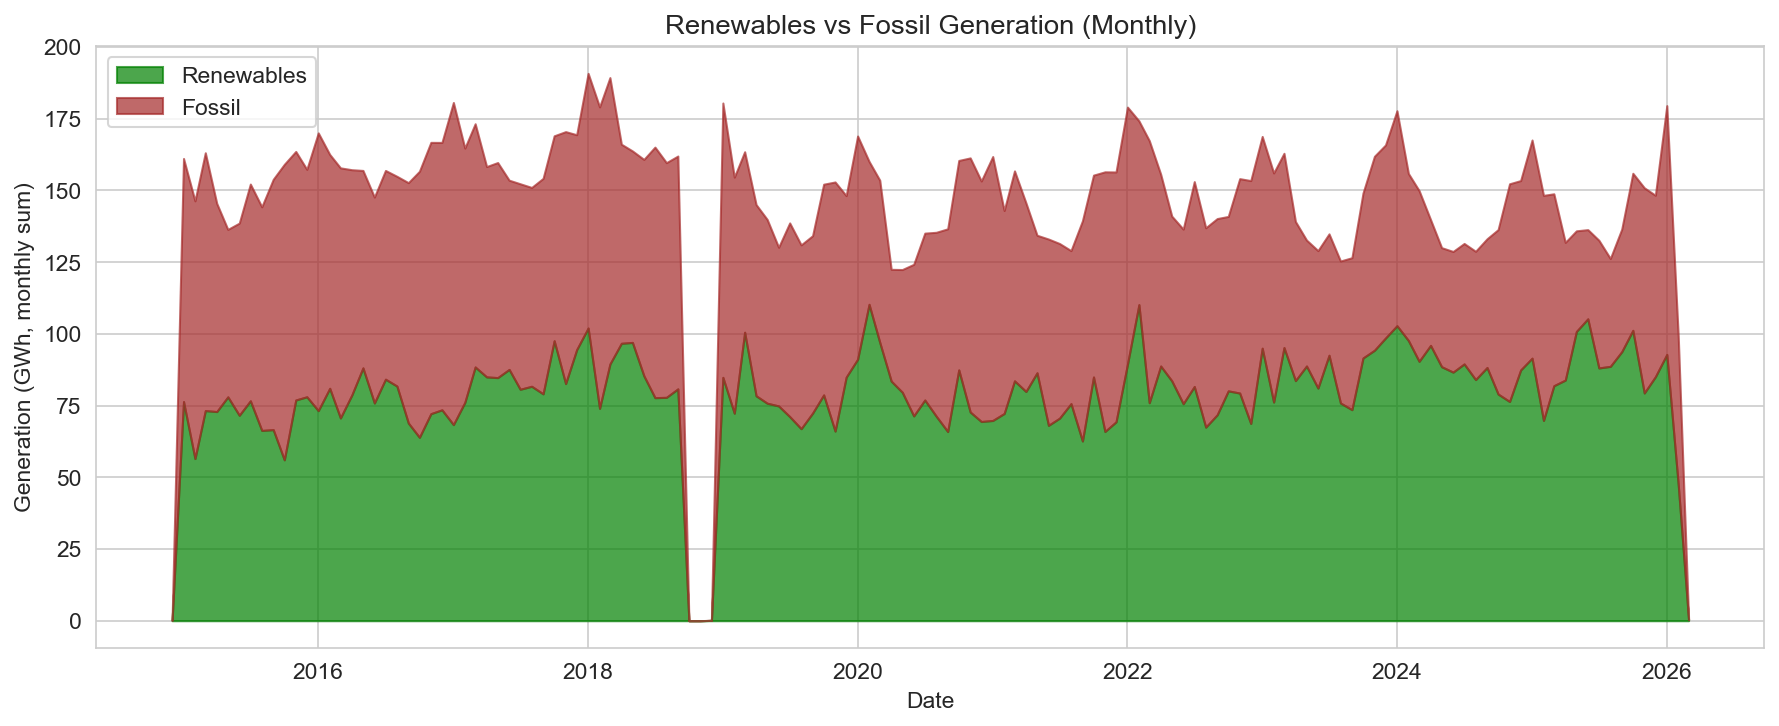
The stacked area of generation by source (fourth figure) over the full period shows how the mix has changed. Coal (brown and hard) and nuclear dominated in the early years; wind (onshore and offshore) and solar grow visibly over time, while gas remains a large, flexible source. Hydro (run-of-river, reservoir, pumped storage) and biomass contribute a stable share. The generation share by year (fifth figure) quantifies the shift: renewables (green) rise from about 36% to about 49%, nuclear (purple) drops to near zero after 2023, and fossil (brown) declines but remains substantial. The renewables vs fossil trend (sixth figure) shows renewables overtaking fossil on a monthly basis in many recent periods, though fossil still covers a large share of demand and flexibility.
Nuclear (eighth figure) drops sharply in April 2023 when Germany’s last nuclear plants were shut down; the series stays near zero afterward. Before that, nuclear provided a stable baseload of several gigawatts; after the phase-out, gas, coal, and imports fill the gap.
Renewables in detail
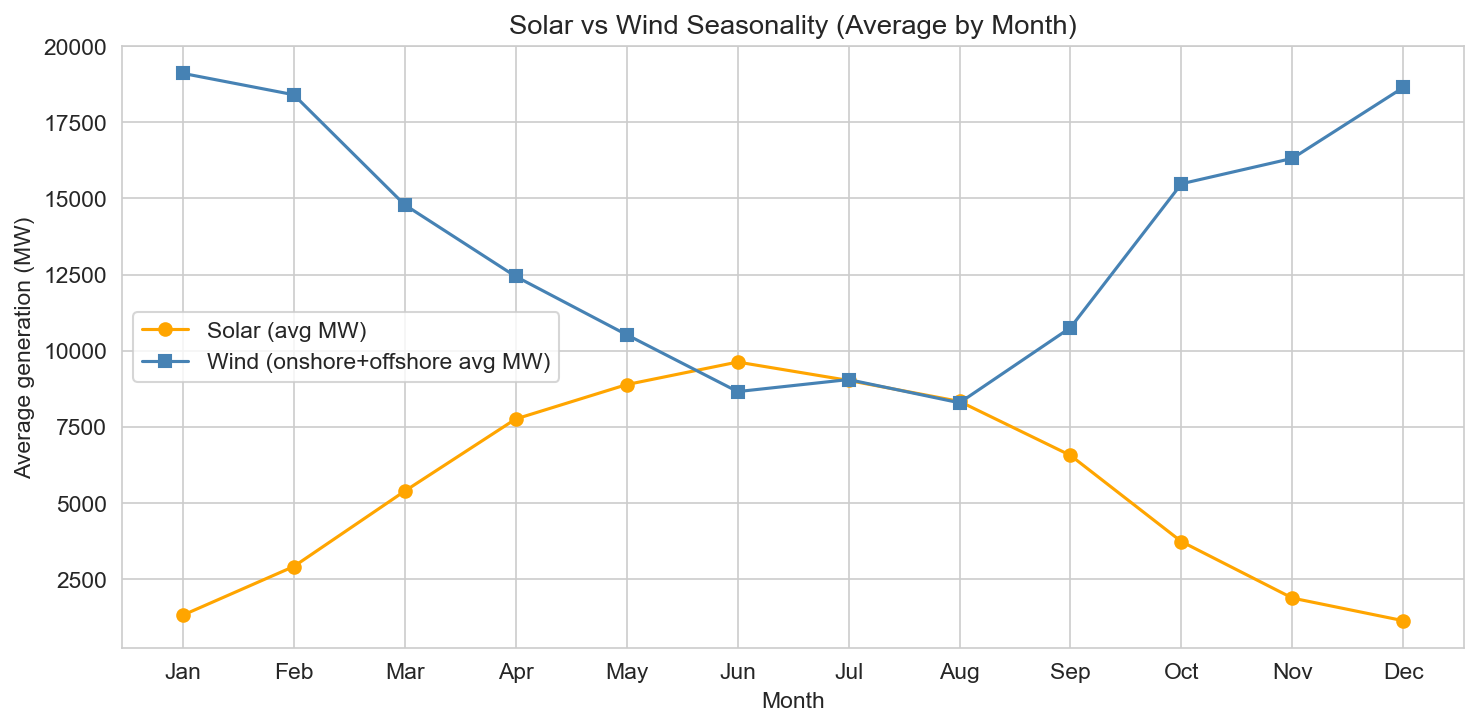
Solar and wind have different seasonal patterns (seventh figure). Solar (orange) peaks in summer and is low in winter; wind (blue) tends to be stronger in the colder months. Together they provide a degree of seasonal complementarity: more solar in summer, more wind in winter. Over the decade, both solar and wind capacity and output have grown; wind (onshore and offshore) and solar now often cover a large share of load during favorable hours, with residual demand met by gas, coal, hydro, and imports.
Cross-border flows
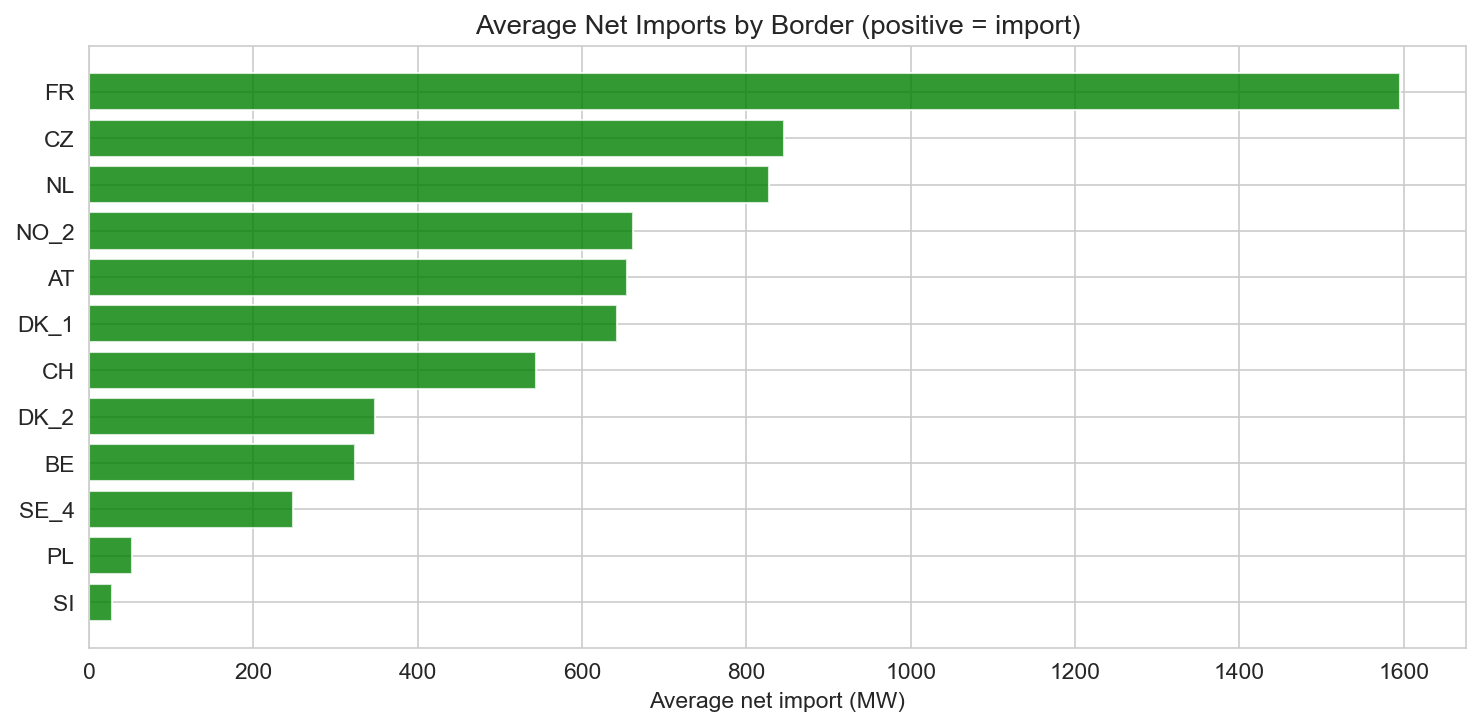
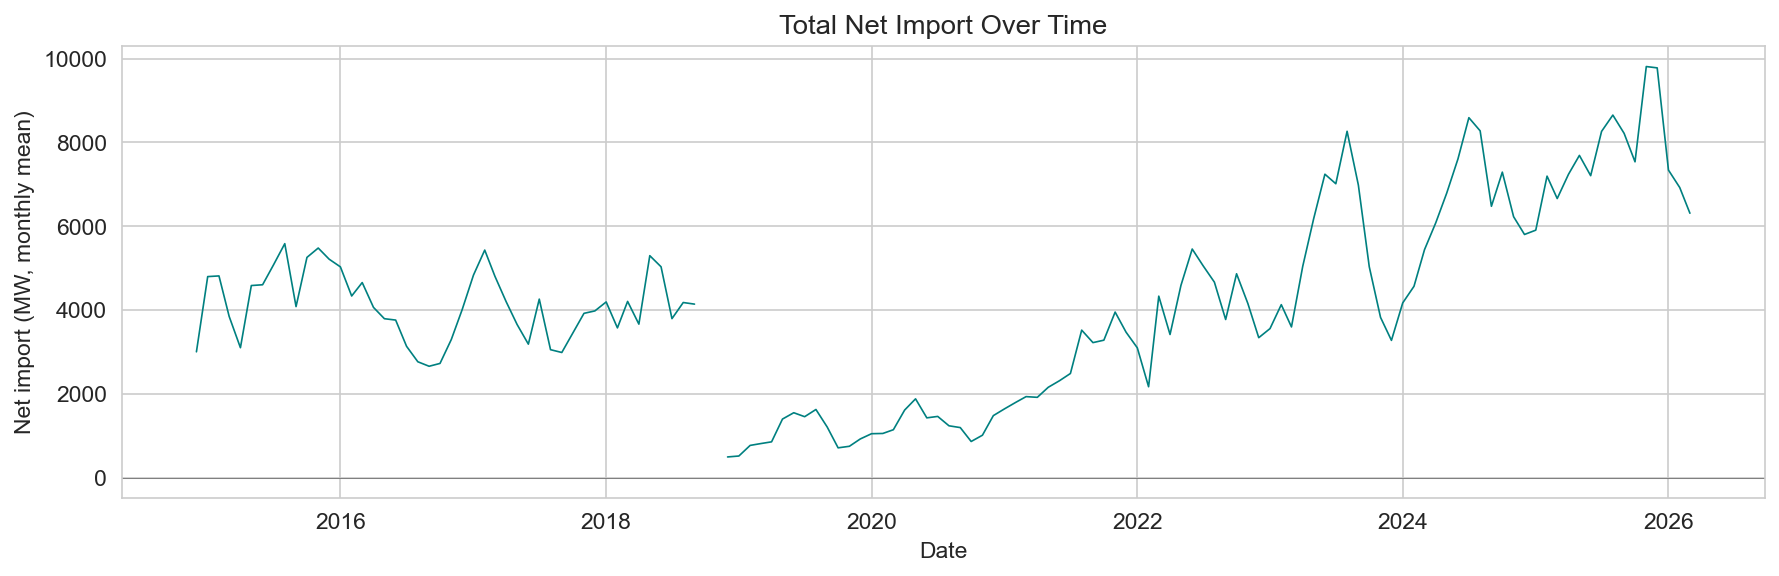
Germany is heavily interconnected with its neighbors. The average net imports by border (ninth figure) show which borders typically see net imports (positive) or exports (negative). France, the Netherlands, Switzerland, and others appear as major partners; the sign and size depend on relative prices, renewables surplus, and demand. The total net import over time (tenth figure) shows that Germany is sometimes a net importer and sometimes a net exporter; the balance fluctuates with weather (wind/solar), demand, and nuclear/fossil availability. Cross-border flows help balance the system and integrate renewables across the European grid.
Forecast vs actual
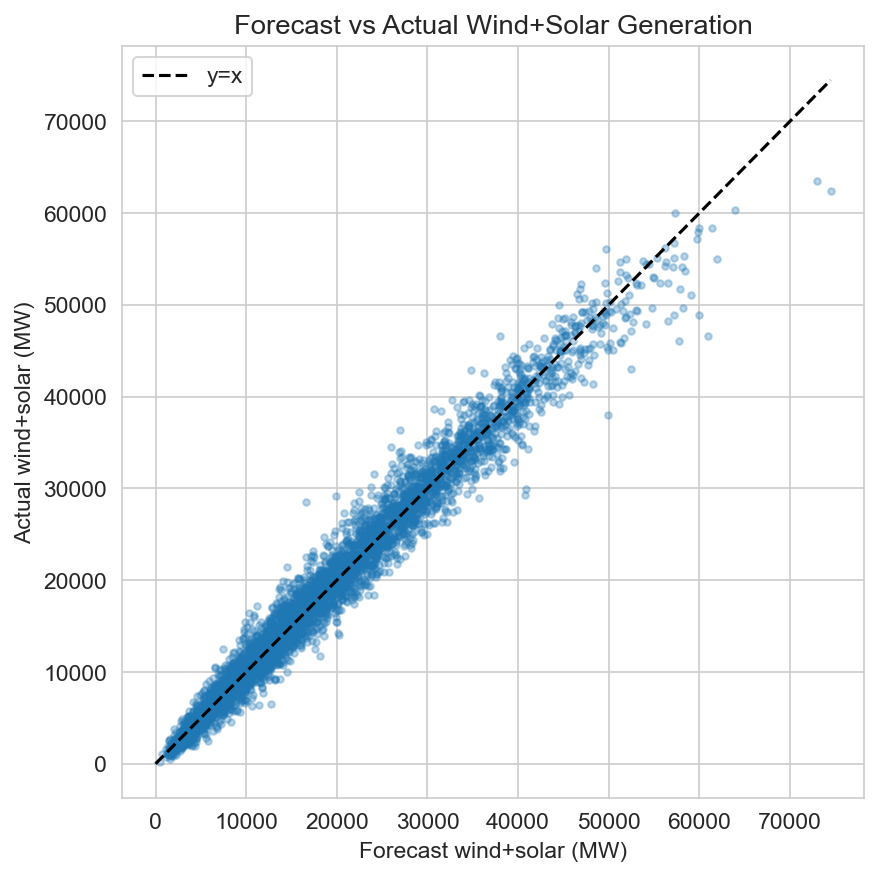
The dataset includes day-ahead wind and solar forecasts (and intraday). The forecast vs actual plot (figure 11) compares the sum of forecasted wind+solar (MW) with the sum of actual wind+solar generation. Points cluster around the diagonal (y=x), indicating that on average the forecasts track actuals reasonably well; scatter reflects forecast error, weather uncertainty, and the 15-minute resolution. Better forecast accuracy supports market and grid operations as renewables penetration grows.
Limitations
This analysis is descriptive and based on a single country and a single dataset. The data are at 15-minute resolution and may contain gaps or revisions; we did not verify against official statistics. Generation and load are aggregate—no breakdown by sector (industry, household, etc.) or by region. Prices are not included. Imports/exports are net per border and do not distinguish commercial vs physical flows in detail. The forecast vs actual comparison is limited to the wind+solar series available in the CSV. No causal claims are made; the aim is to summarize patterns and trends in the dataset.
Conclusion
Using the German Power Consumption dataset (Kaggle, samithsachidanandan), we analyzed about 380,600 intervals of 15-minute data from 2015 to March 2026. Load ranges from about 28,300 MW to 92,400 MW, with a mean near 58,800 MW and clear daily and seasonal patterns. The generation mix has shifted strongly toward renewables (from about 36% to about 49% share), while nuclear dropped to near zero after the April 2023 phase-out and fossil share declined but remained significant. Wind and solar show complementary seasonality and have grown over the period. Cross-border flows are large and variable, and wind+solar forecasts track actuals reasonably well in the data. This post is a descriptive, data-driven overview of the dataset—not a policy or market analysis—and all findings depend on the CSV and the processing choices described below.
Data and methodology
- Source: German Power Consumption by samithsachidanandan on Kaggle.
- Data: 15-minute resolution; datetime index; columns used include
load_Actual Load; generation columns with Actual Aggregated (Biomass, Fossil Brown coal/Lignite, Fossil Coal-derived gas, Fossil Gas, Fossil Hard coal, Fossil Oil, Geothermal, Hydro Pumped Storage, Hydro Run-of-river and poundage, Hydro Water Reservoir, Nuclear, Other, Other renewable, Solar, Waste, Wind Offshore, Wind Onshore); wind and solar forecast columns; and import columns (CH, CZ, DK_1, DK_2, FR, IT_NORD, IT_NORD_AT, NL, PL, SE_4, SI, sum, BE, AT, NO_2). - Processing: Index parsed as datetime (UTC); missing load rows dropped; missing generation filled with 0 for aggregation. Derived series: total generation, renewables (wind, solar, hydro, biomass, other renewable), fossil (coal, gas, oil, coal-derived gas), nuclear; forecast and actual wind+solar for comparison. Resampling: daily and monthly for trend and stack plots.


