

What do prices, brands, ratings, and discounts look like in the market for gaming laptops and related hardware in early 2026? This post uses the Gaming Laptops 2026 dataset by kanchana1990 on Kaggle—614 products with title, brand, price, list price, discount percentage, star rating, review count, product category (breadCrumbs), and description—to answer that. We walk through the dataset at a glance, the price landscape by brand and product type, discounts and list prices, ratings and reviews, brand and category mix, price tiers, correlations, and a GPU-tier view parsed from product titles. Dataset credit: Gaming Laptops 2026 (Kaggle, kanchana1990).
The dataset at a glance
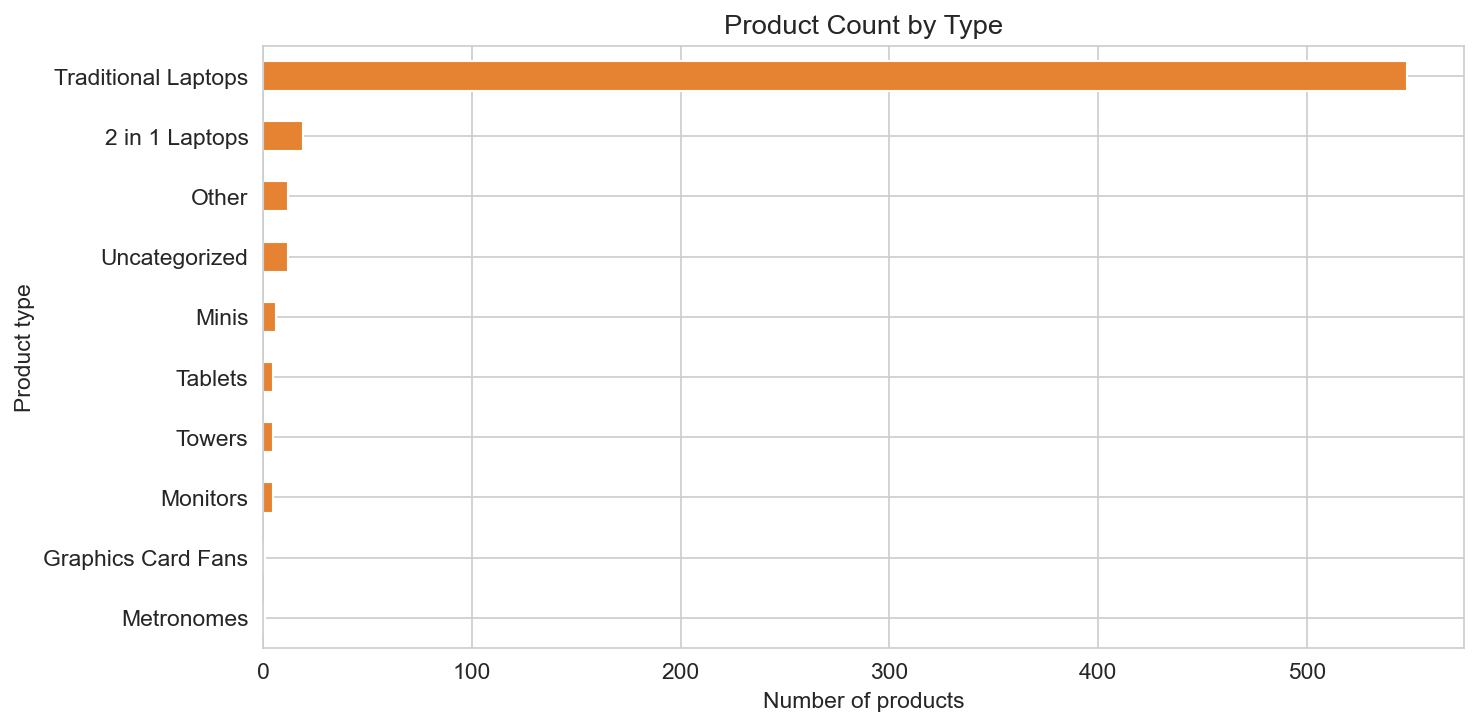
After keeping only rows with valid price (positive), we have 614 products. Columns include title, brand, price (USD), list_price and discount_pct (where a list price exists), stars (1–5), reviews_count, breadCrumbs (category path), and description. There are 39 brands; the majority of products are Traditional Laptops (548), followed by 2-in-1 Laptops (19), Monitors (5), Towers (desktops, 5), Minis (6), Tablets (5), and a smaller set labeled Computers & Tablets or Uncategorized (24 combined). Median price is about $1,450 and mean about $1,650; the 25th and 75th percentiles sit near $1,035 and $2,004. 115 products have a list price; among those, average discount is about 18%. Mean star rating is 4.4; total review count across the sample is about 60,000. So we are looking at a mix of gaming and general computing products, with a strong emphasis on traditional laptops and a wide spread of prices and engagement.
Price landscape
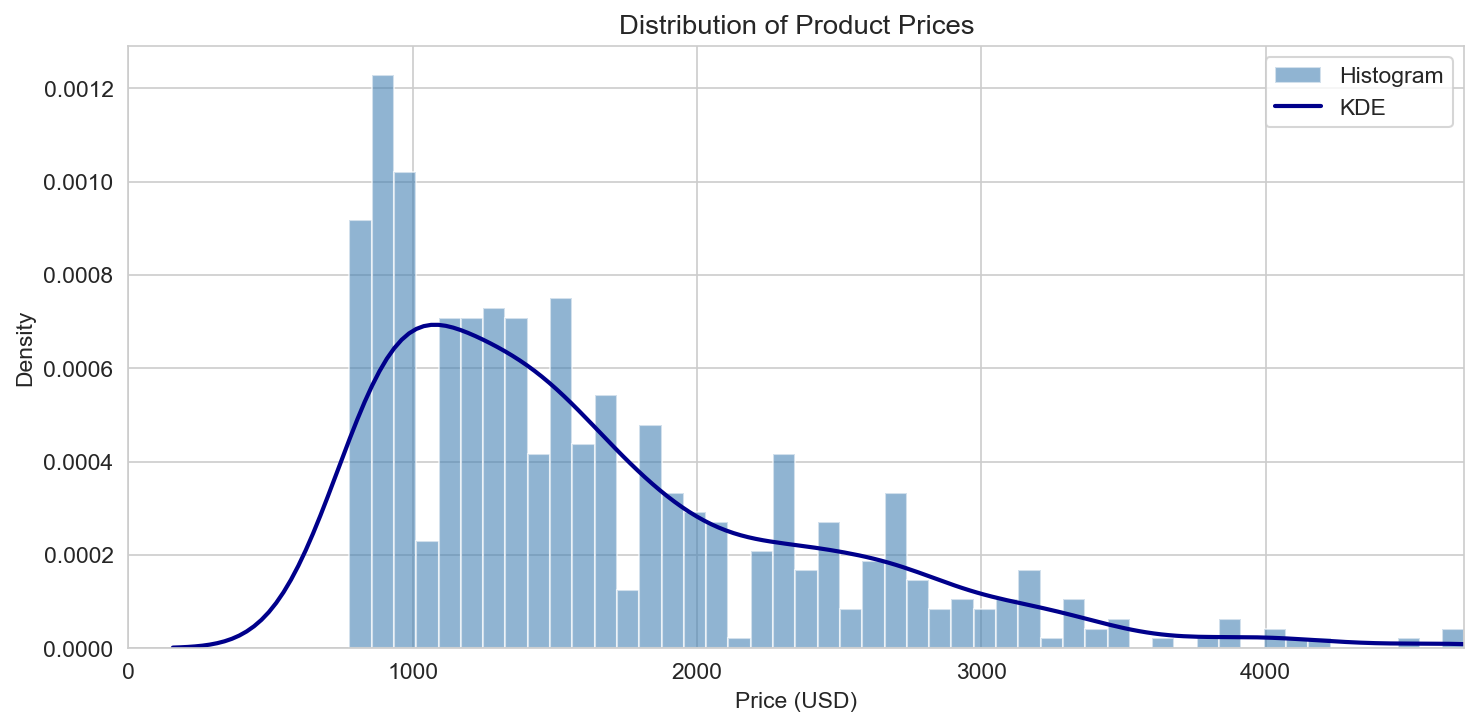
The distribution of prices (histogram and KDE) shows a right-skewed shape: most products sit between roughly $800 and $2,500, with a long tail up to several thousand dollars. The chart caps the x-axis at $5,000 for readability; a few high-end desktops and workstations extend beyond that.
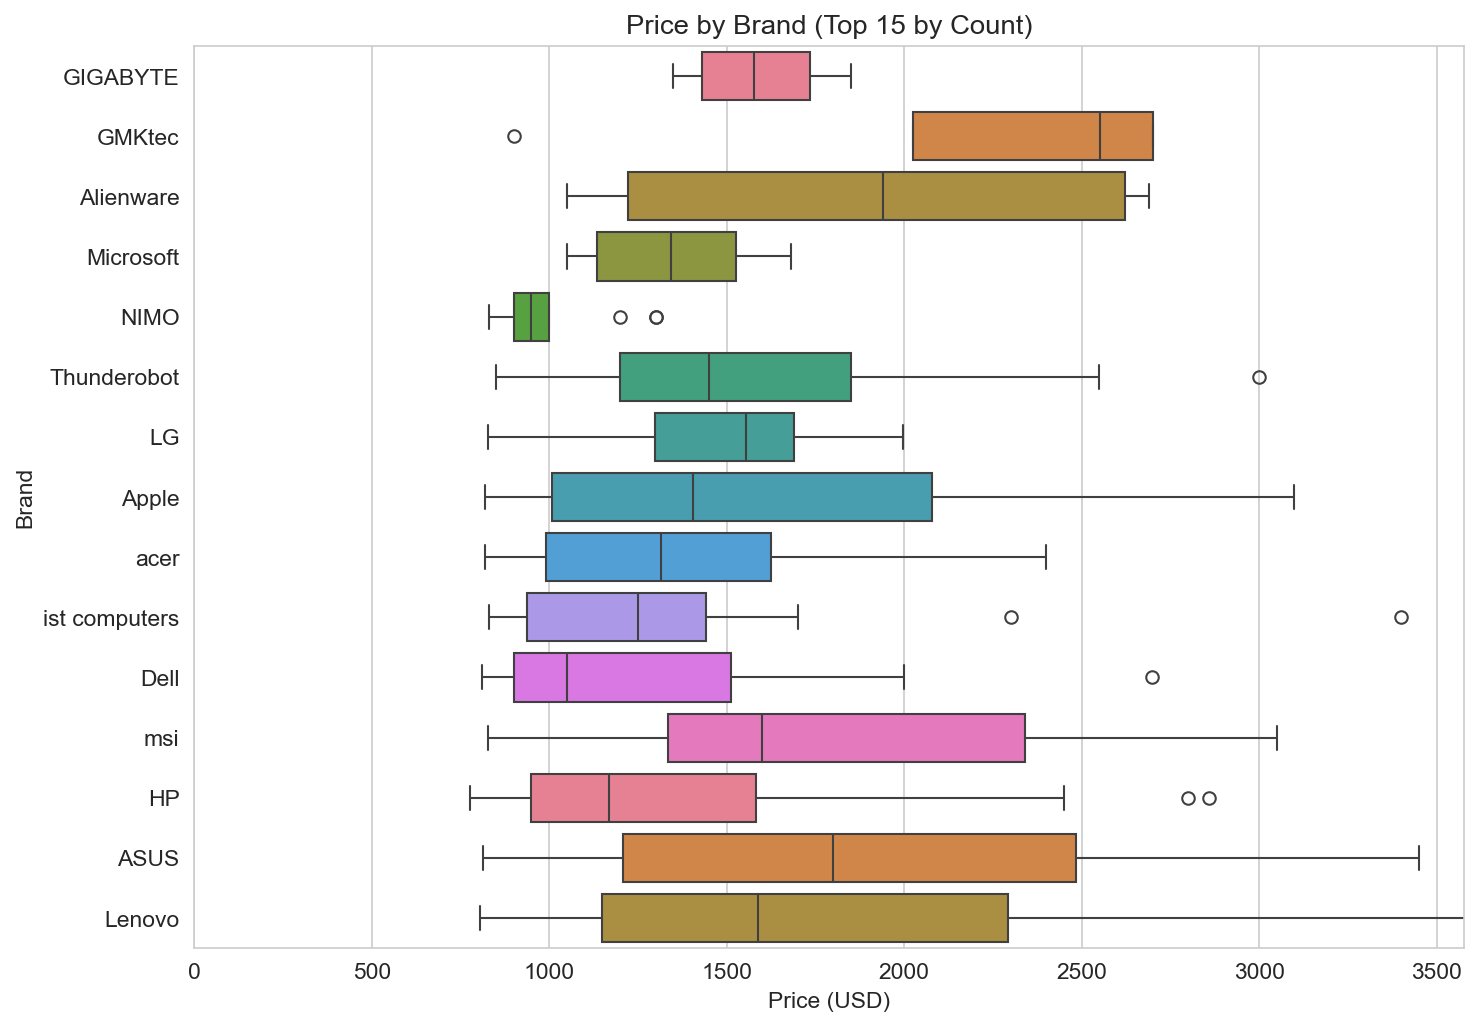
Price by brand (box plot for the top 15 brands by product count) highlights how positioning differs: some brands concentrate in budget or mid tiers, others span from mid to premium. Outliers within brands reflect different SKUs (e.g. entry-level vs flagship). Product count by brand (horizontal bar, top 18) shows which brands have the most listings in this sample—useful for interpreting the price boxes and for market presence.
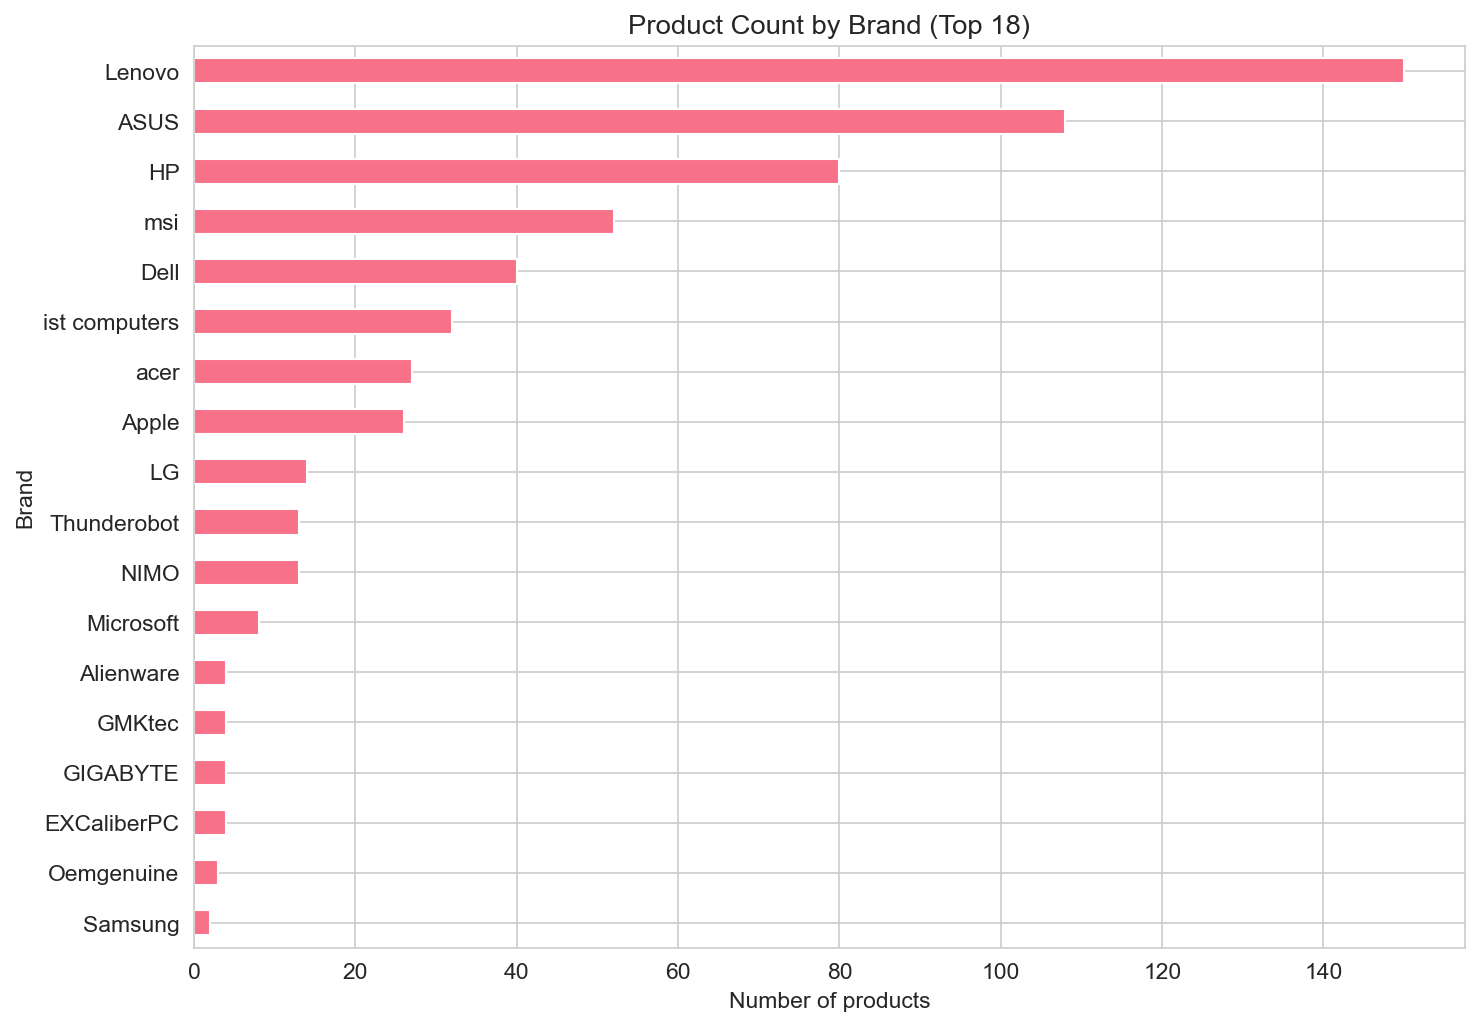
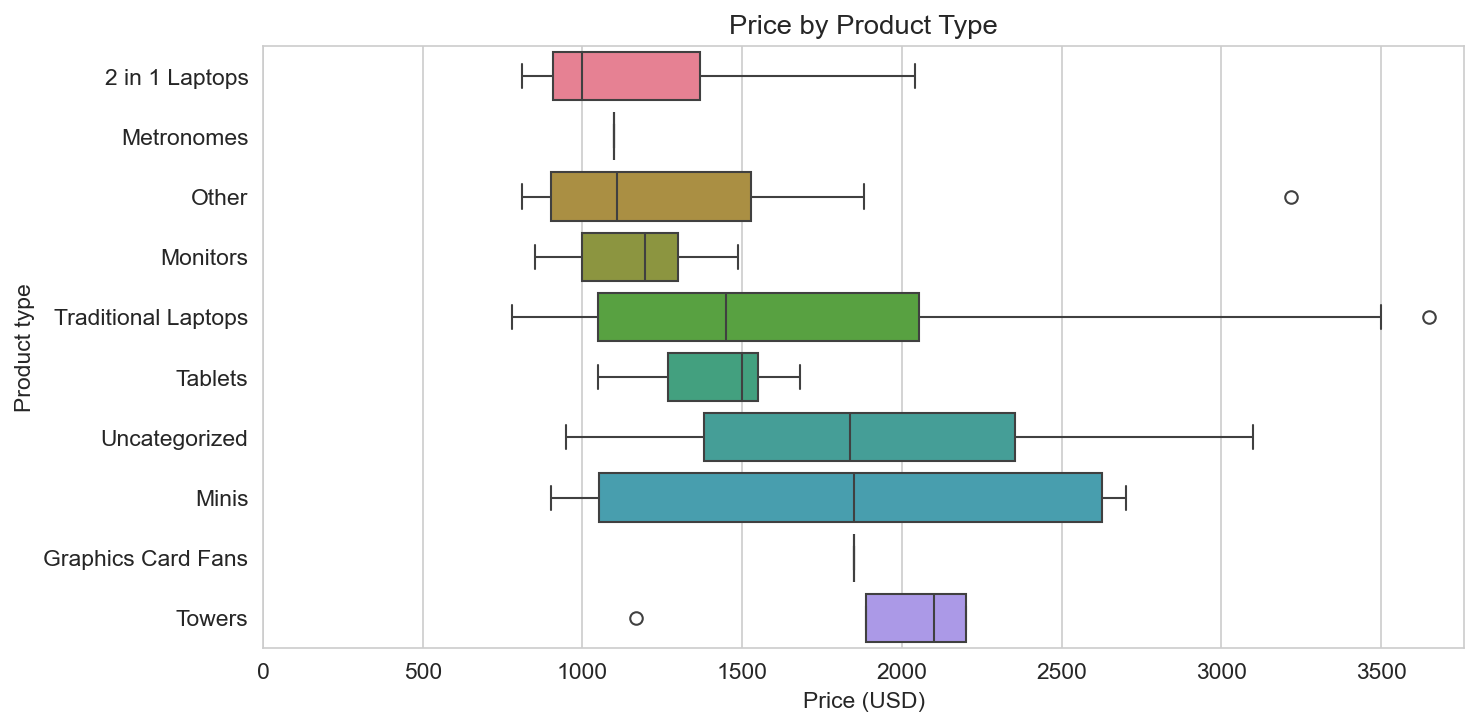
Price by product type (box plot) compares Traditional Laptops, 2-in-1 Laptops, Monitors, Towers, Minis, Tablets, and the rest. Laptops dominate the count; desktops (Towers) and some monitors can sit higher in price for high-end configs. Count by product type (horizontal bar) summarizes the category mix and confirms that traditional laptops are the bulk of the dataset.
Discounts and list prices
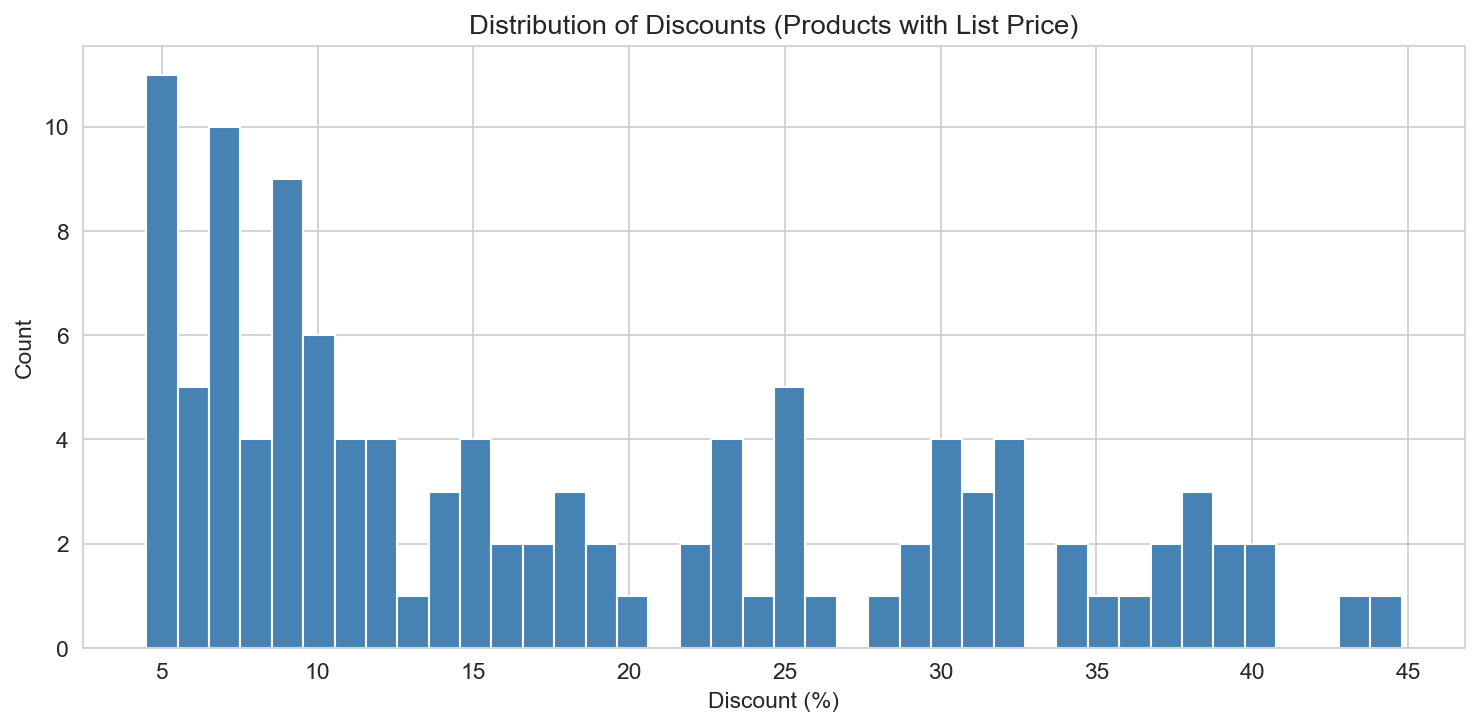
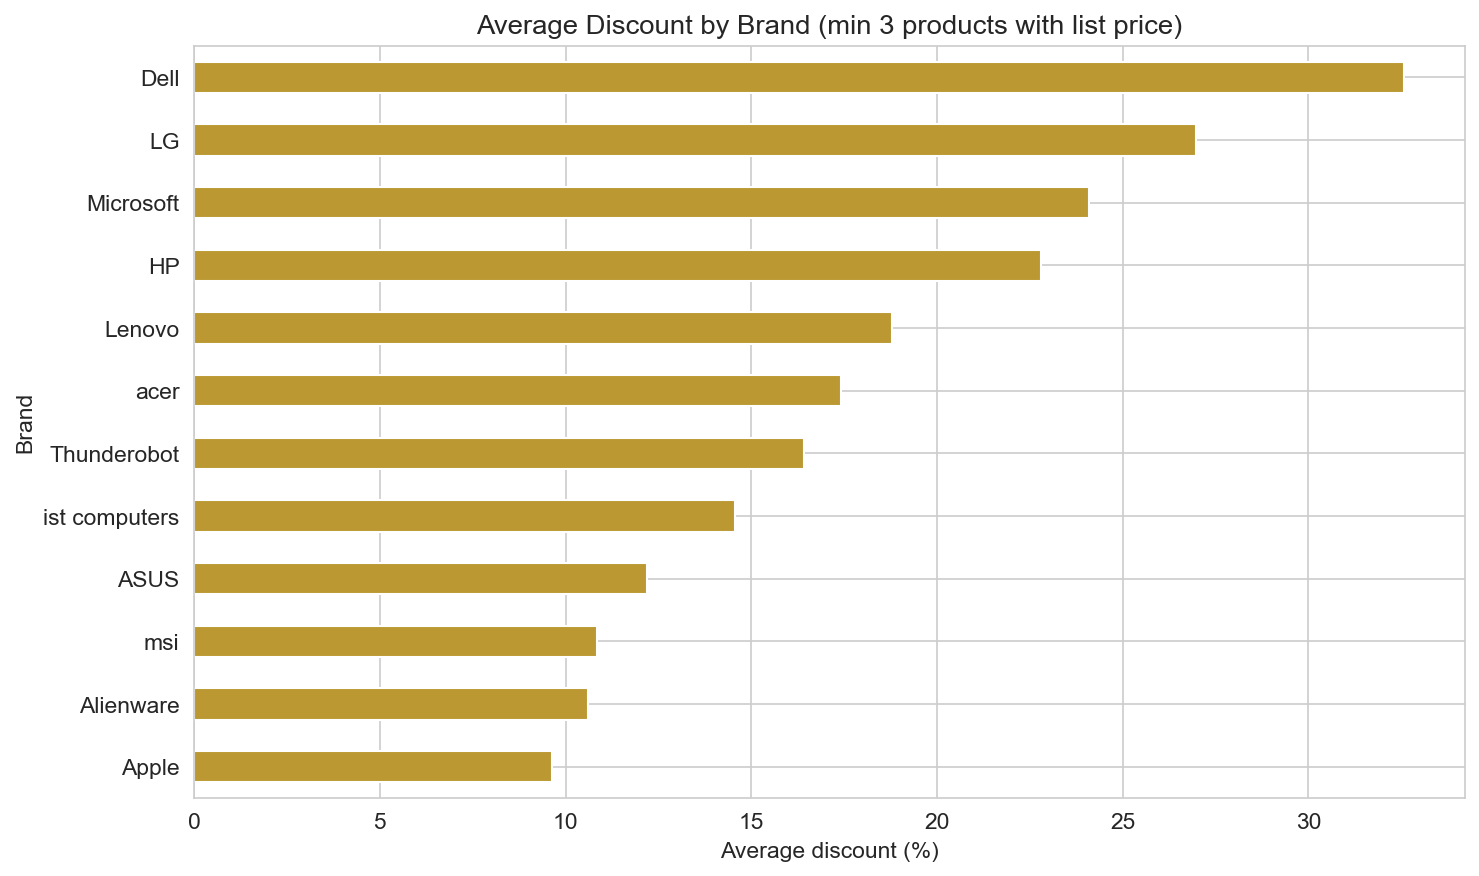
Only 115 products in the sample have a list price; the rest have no list price or a missing value, so discount analysis is limited to that subset. Among those, discount percentage varies widely; the distribution of discount_pct (histogram) shows how often products are discounted and by how much. Average discount by brand (horizontal bar, brands with at least three products that have a list price) reveals which brands in this slice discount more heavily—useful for understanding promotional behavior in the data.
Ratings and reviews
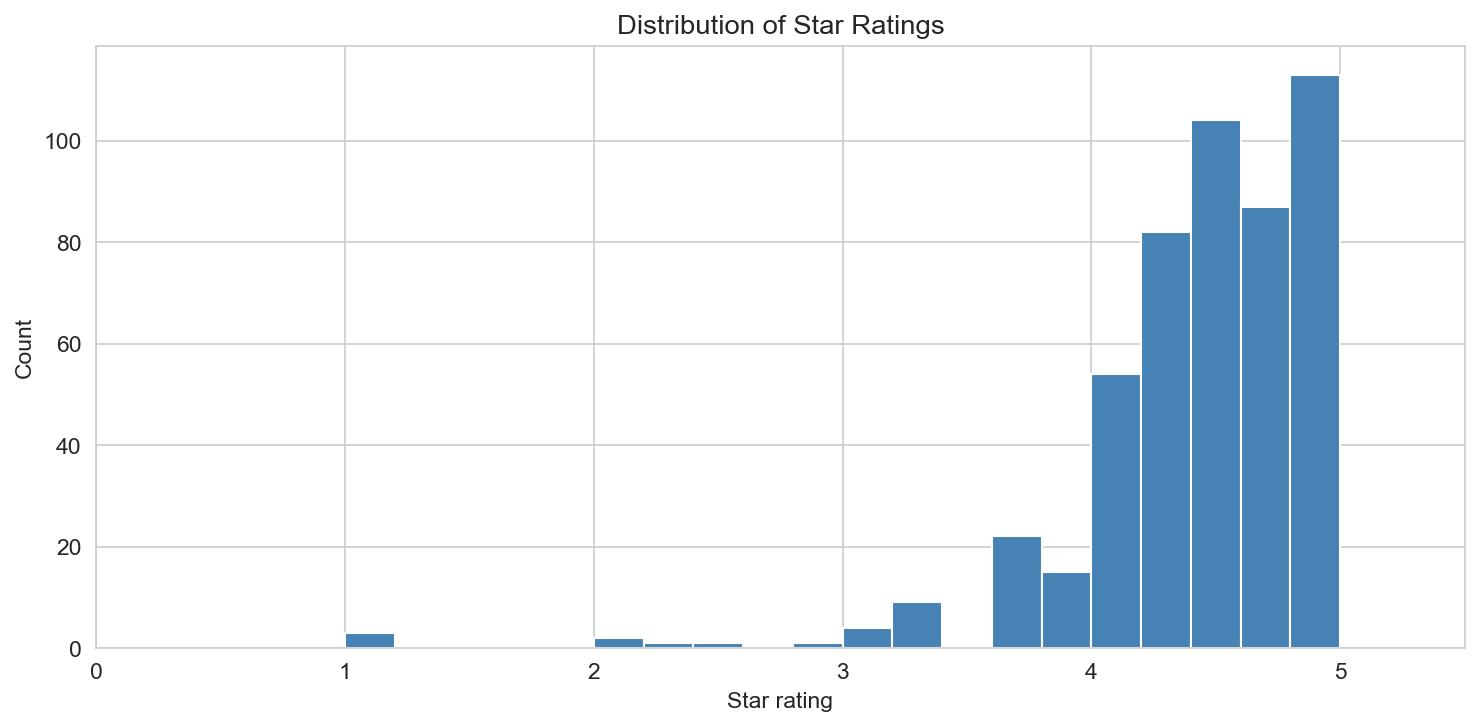
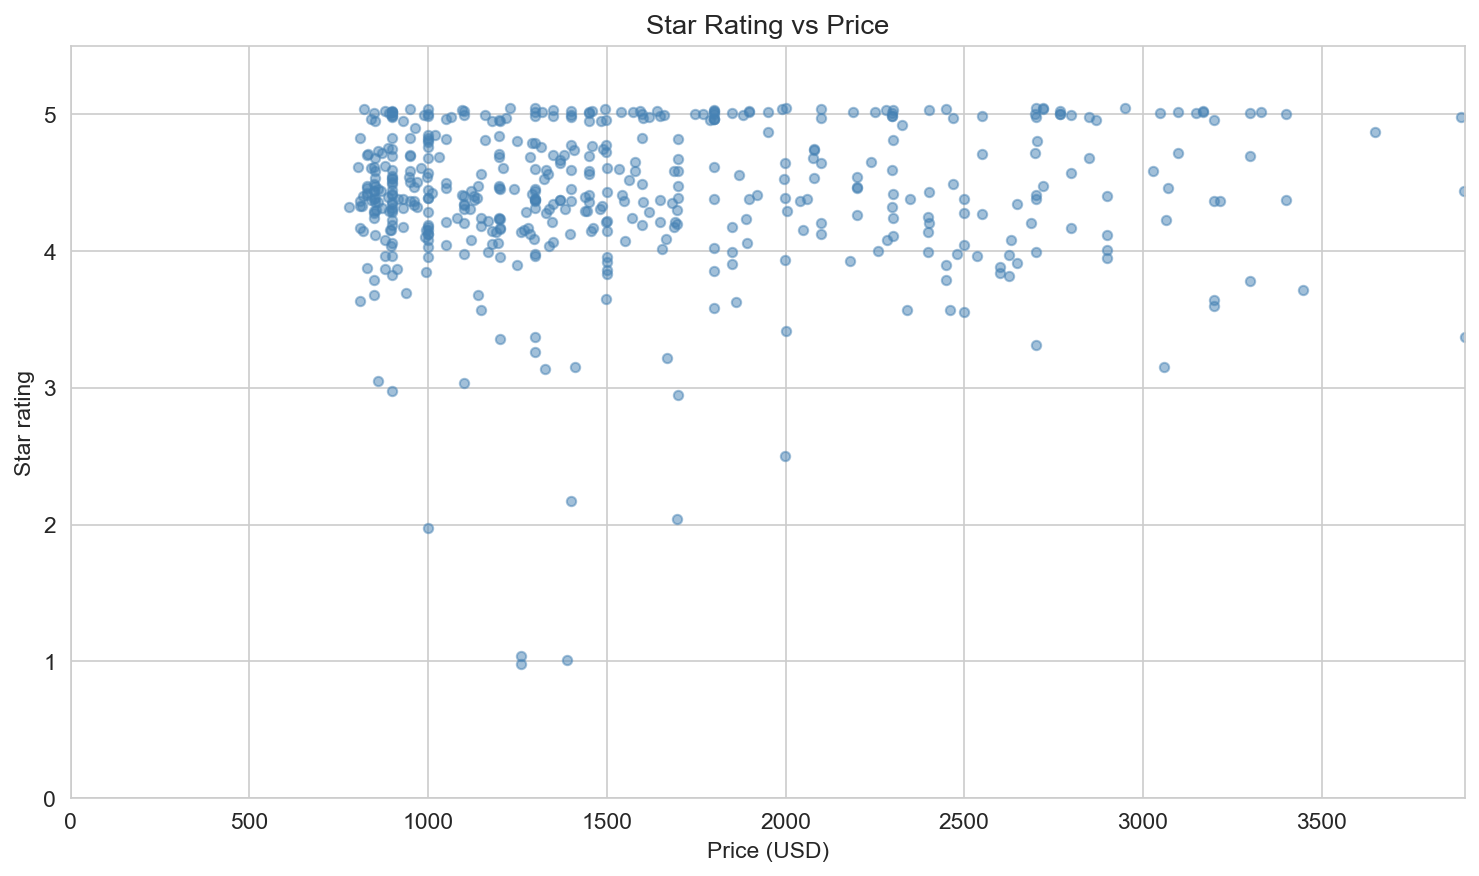
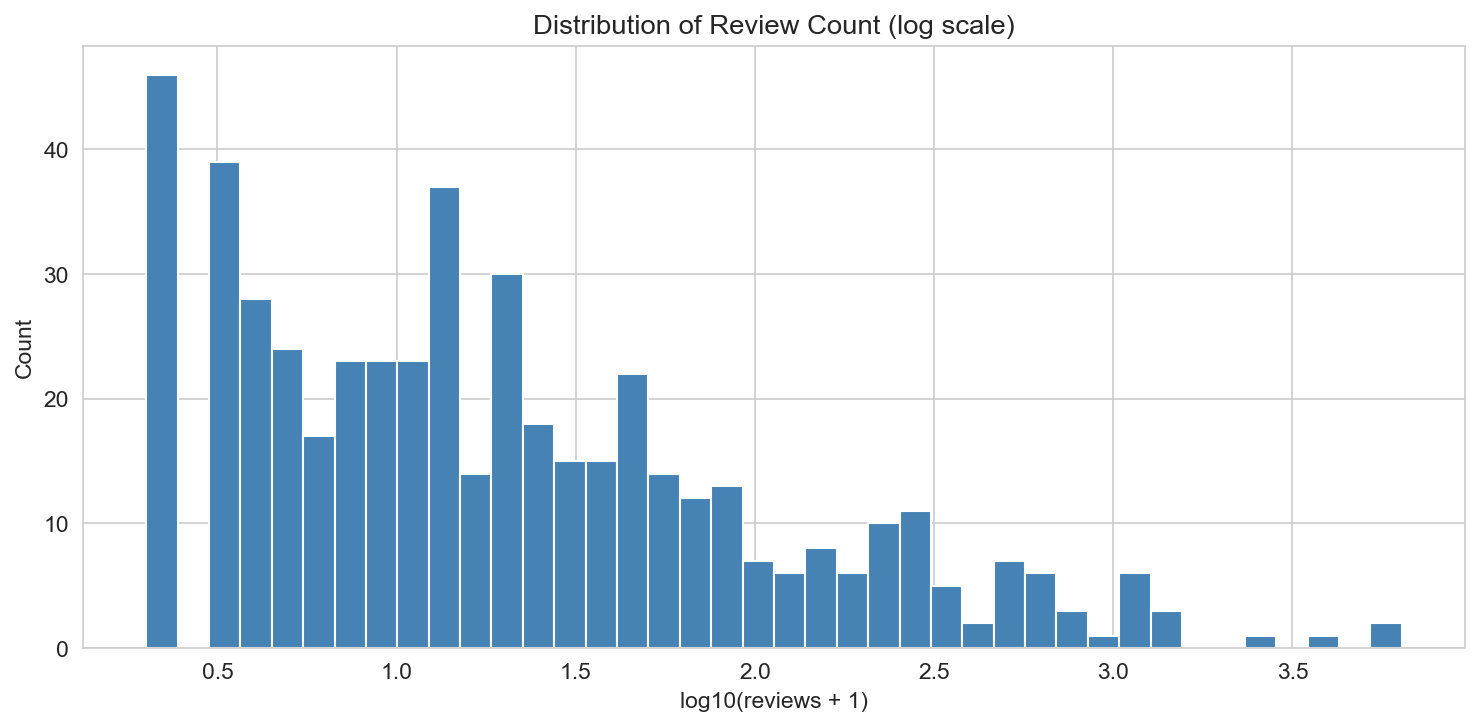
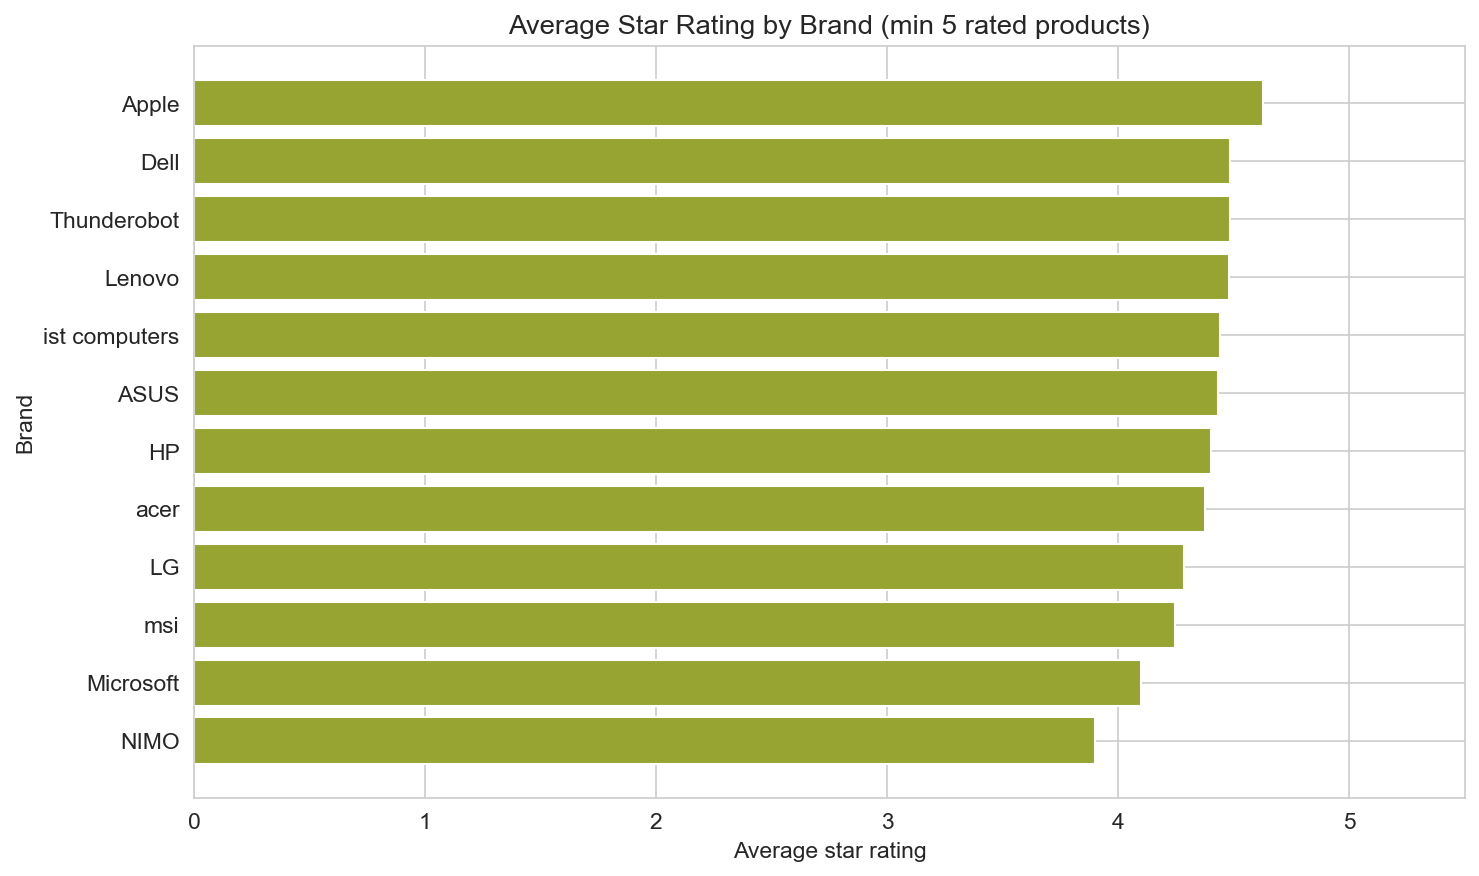
Star ratings (1–5) are right-skewed: many products sit in the 4–5 range; the distribution of stars (histogram) makes that clear. Stars vs price (scatter, with slight jitter for visibility) shows that pricier products do not systematically rate higher—there is a lot of overlap, and value and quality are not simply “pay more, get better ratings” in this sample. Review count is highly skewed: a few products have thousands of reviews, most have far fewer. The distribution of review count (on a log scale) illustrates that spread. Average stars by brand (horizontal bar, brands with at least five rated products) gives a quality signal by brand; combined with count, it helps identify brands that are both well represented and highly rated.
Price tiers and segment overview
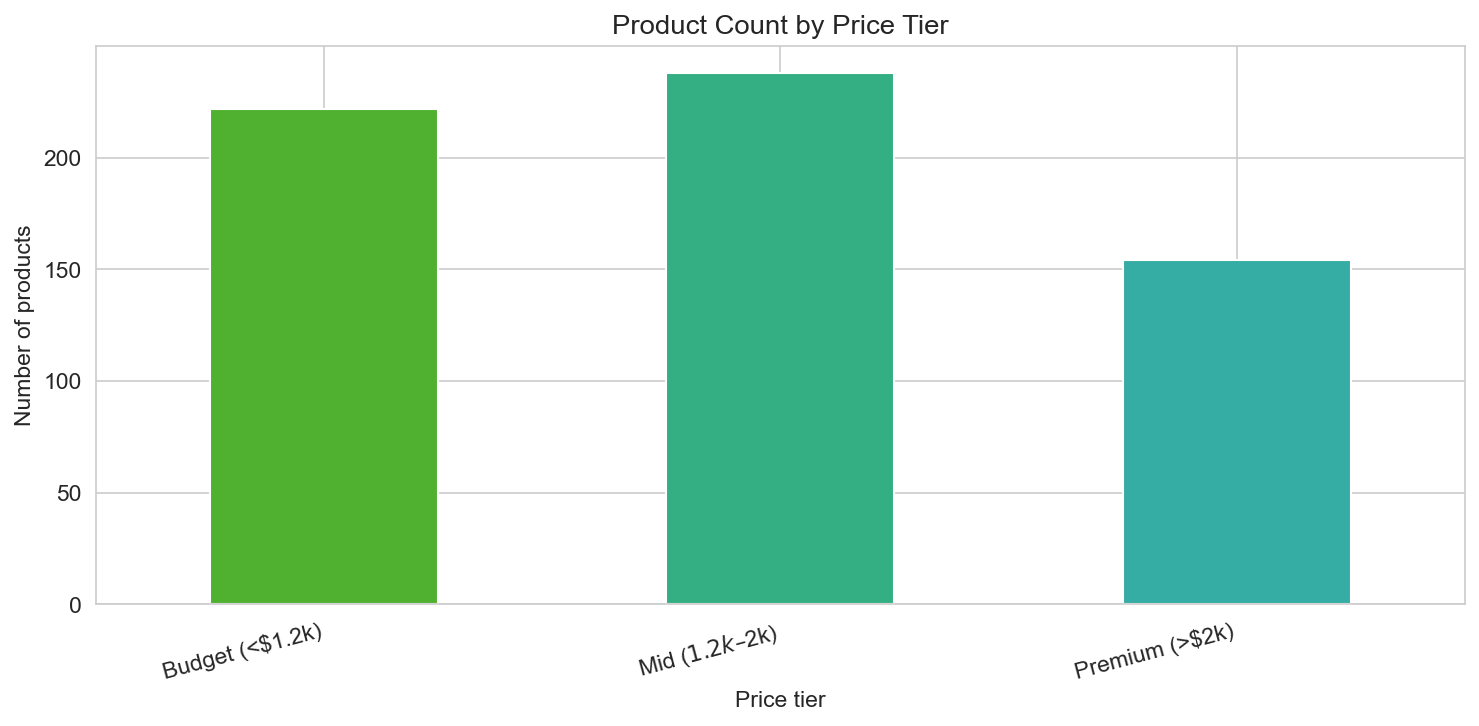
We define price tiers: Budget (under $1,200), Mid ($1,200–$2,000), and Premium (over $2,000). The product count by price tier (bar chart) shows how many products fall into each segment. The bulk of the sample sits in Mid, with a substantial Budget slice and a smaller Premium tail—consistent with the price distribution and with a market where mid-range gaming laptops and PCs are the most common listings.
Relationships in the data
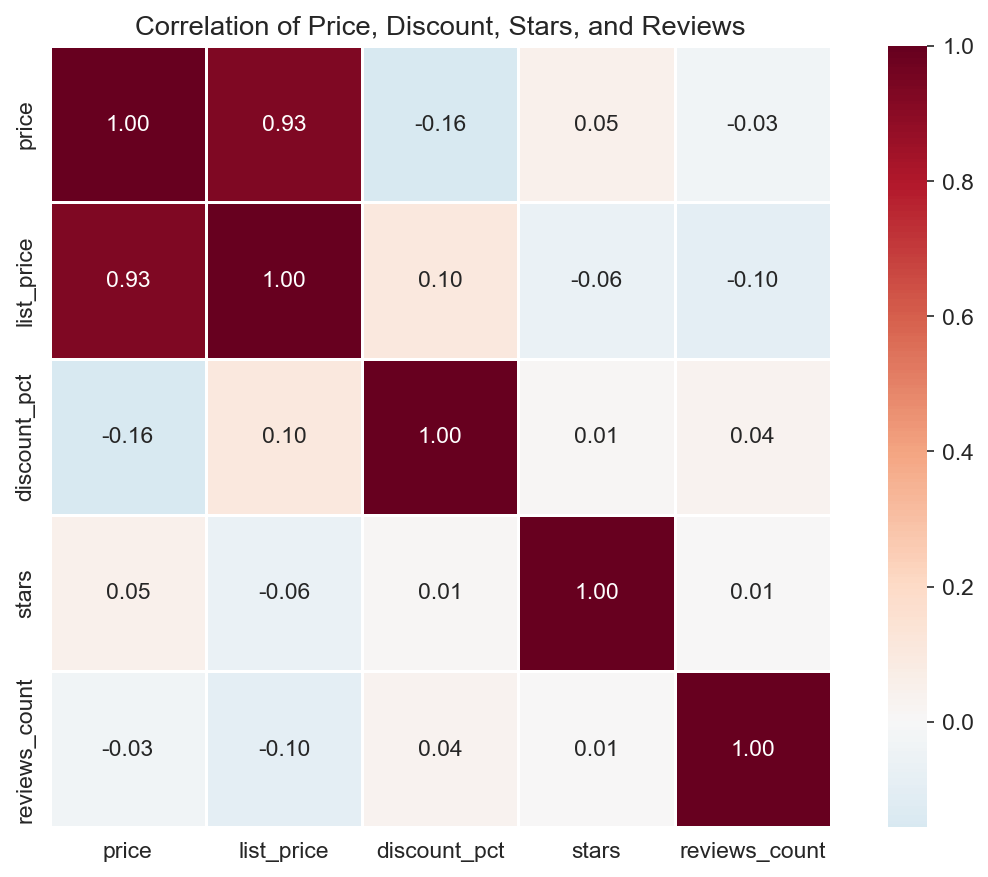
A correlation heatmap of price, list_price, discount_pct, stars, and reviews_count summarizes linear relationships. For example: list_price and price are strongly positively correlated (as expected); discount_pct may correlate with price or list_price in this subset where list price exists. Stars and reviews_count can be weakly related (more reviews sometimes accompany higher or lower ratings depending on product). The heatmap is a compact way to see which numeric variables move together in this dataset.
GPU and gaming focus
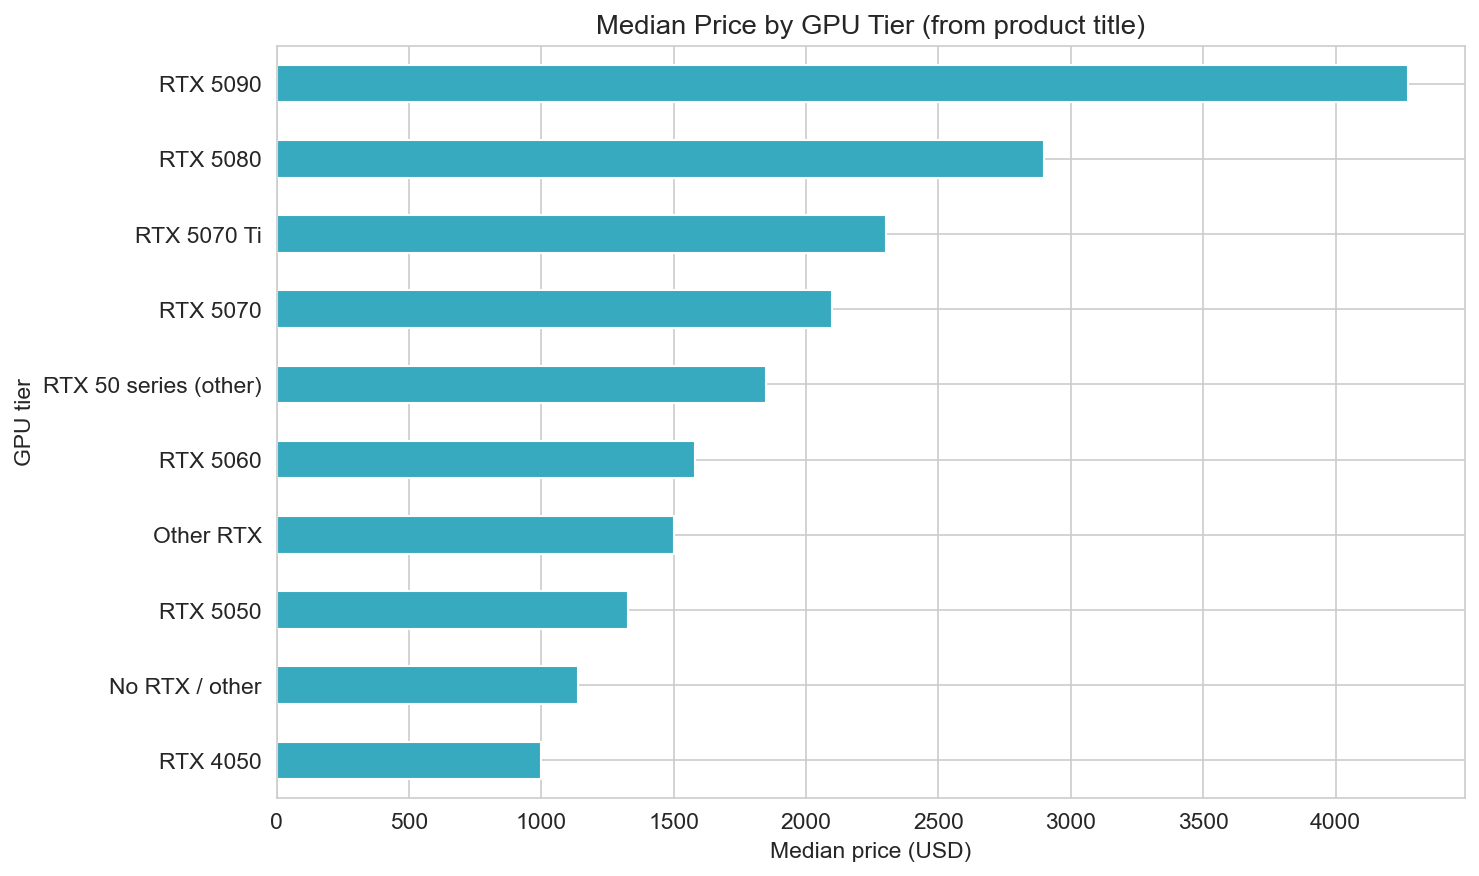
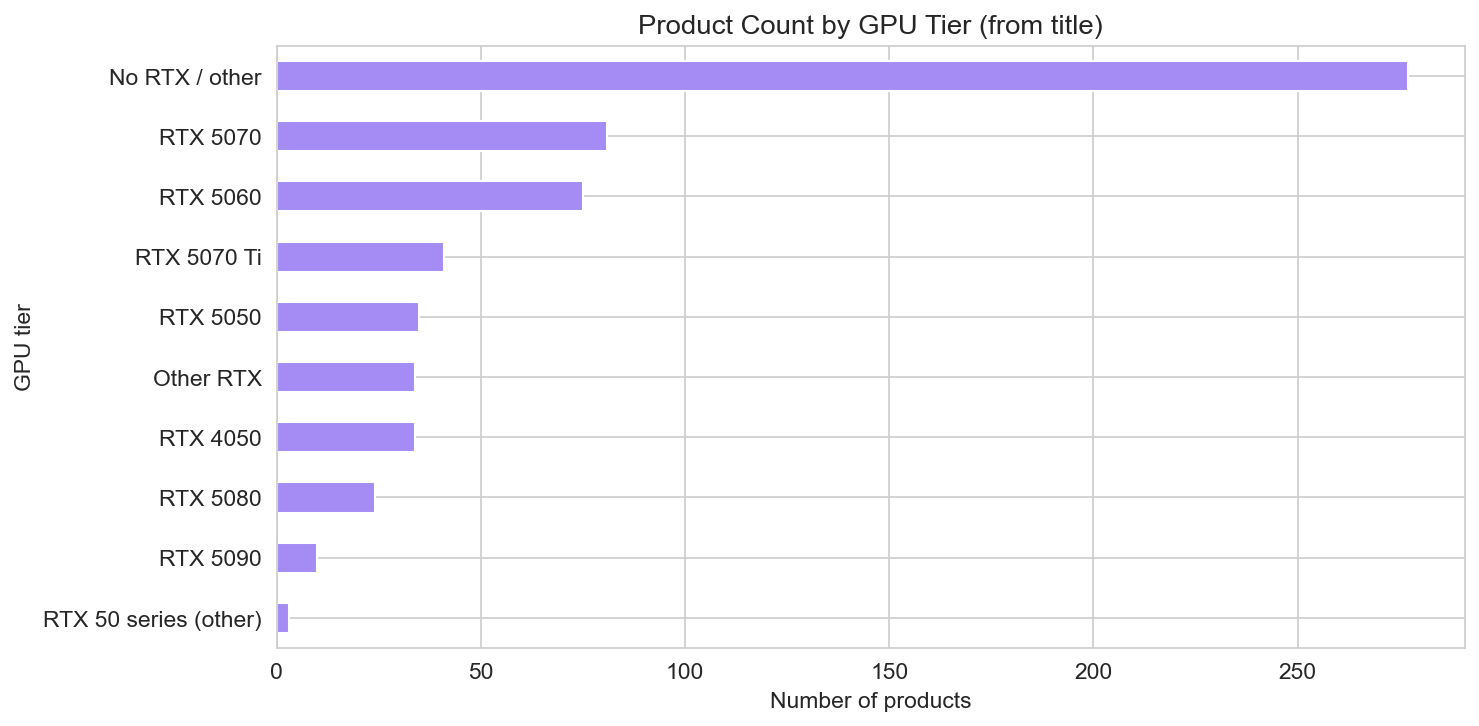
Product titles (and descriptions) often mention GPU model (e.g. RTX 4050, 5060, 5070, 5080, 5090). We parsed a GPU tier from the title for each product and grouped into: RTX 5090, 5080, 5070 Ti, 5070, 5060, 5050, 4050, “RTX 50 series (other),” “Other RTX,” and “No RTX / other.” Median price by GPU tier (horizontal bar) shows that higher-tier GPUs (e.g. RTX 5080, 5090) are associated with higher median prices, while RTX 4050/5050/5060 products sit in lower price bands. Product count by GPU tier (horizontal bar) shows how many products in the sample fall into each tier—useful for understanding how much of the data is explicitly RTX 50 series and how the market is distributed across GPU tiers in this snapshot.
Notable products: most reviewed
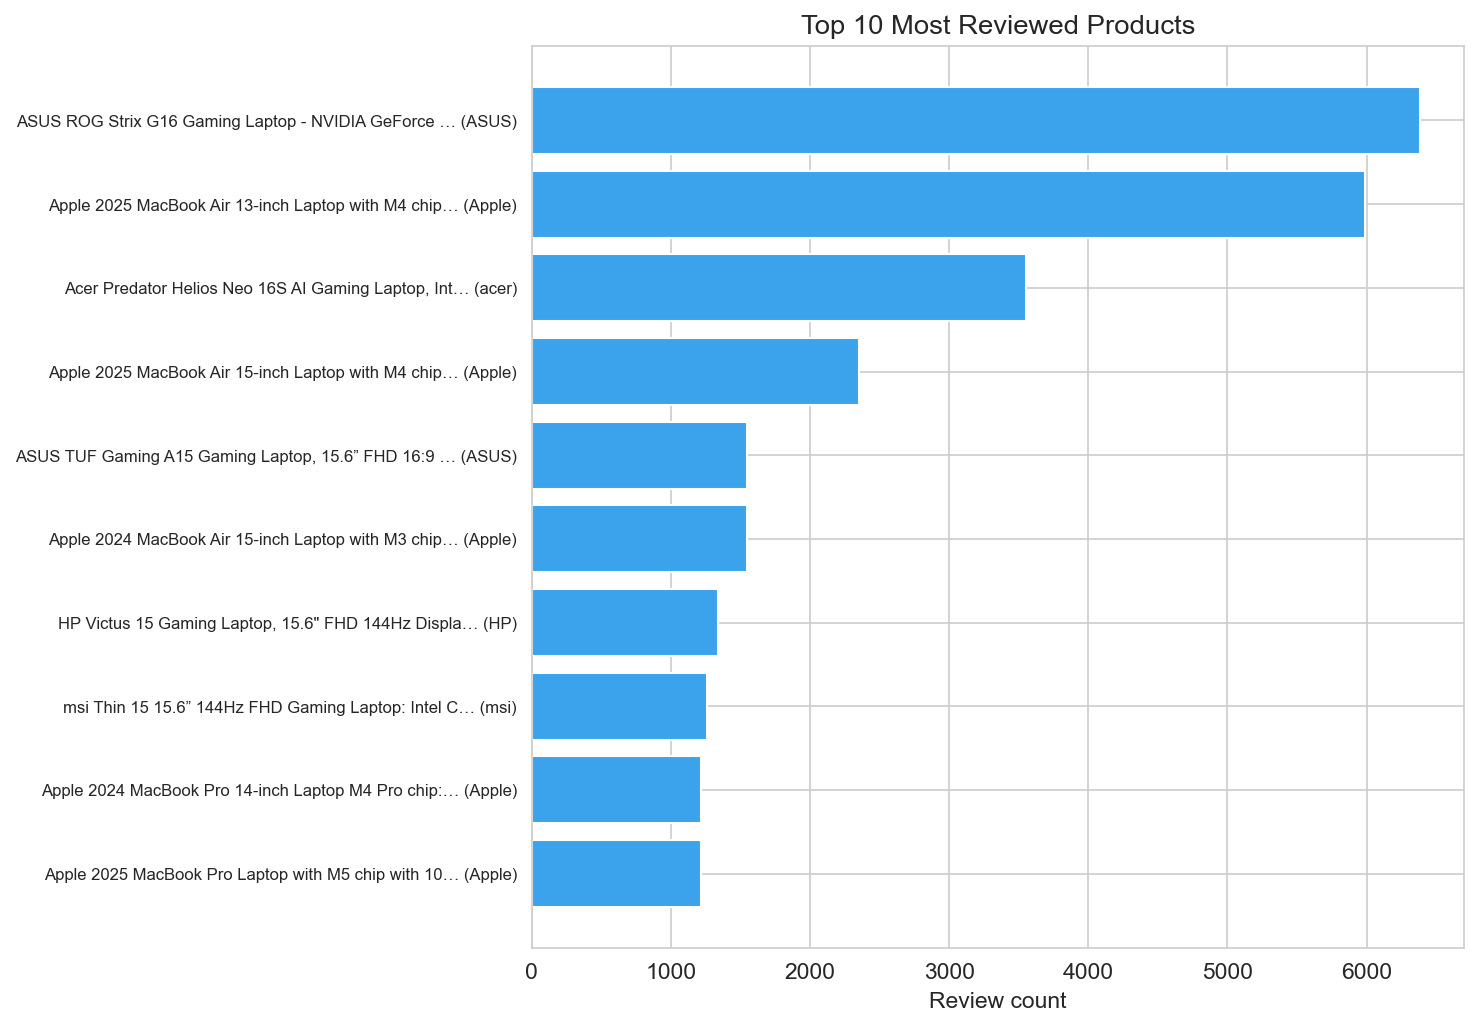
The top 10 most reviewed products (horizontal bar, with truncated title and brand) highlight which SKUs in this dataset have attracted the most reviews. These are not necessarily the “best” products but the most visible in terms of review volume; they often correspond to popular mainstream or entry-level models.
Takeaways
- The dataset has 614 products with valid price, spanning 39 brands, with Traditional Laptops (548) dominating, followed by 2-in-1s, Monitors, Towers, Minis, and Tablets.
- Median price is about $1,450 and mean about $1,650; the distribution is right-skewed with most products between roughly $1,000 and $2,500.
- 115 products have a list price; among them average discount is about 18%; discount levels vary by brand.
- Mean star rating is 4.4; total reviews sum to about 60,000. There is no strong “pay more, rate higher” pattern in the stars-vs-price scatter.
- Price by brand and by product type show clear positioning differences; price tiers (Budget / Mid / Premium) put most products in Mid.
- GPU tier (parsed from titles) aligns with price: higher RTX tiers (5080, 5090) have higher median prices; RTX 5050/5060/4050 products sit in lower bands.
- The correlation heatmap ties price, list price, discount, stars, and review count into one view for numeric relationships.
- For the full dataset and to run your own analysis, use Gaming Laptops 2026 (Kaggle, kanchana1990).
Data and methodology
The analysis uses the Gaming Laptops 2026 dataset (Kaggle, kanchana1990): 614 products with title, brand, price, list_price, discount_pct, price_currency, stars, reviews_count, breadCrumbs, and description. We dropped rows with missing or non-positive price; stars were clipped to 0–5 and review counts to non-negative. Product type was derived from the last segment of breadCrumbs (e.g. Traditional Laptops, Monitors, Towers). GPU tier was inferred from title using string matching for RTX 40/50 series model names. Price tier is Budget (<$1.2k), Mid ($1.2k–$2k), or Premium (>$2k). Figures were generated with pandas, matplotlib, and seaborn. Dataset credit: Gaming Laptops 2026 (Kaggle, kanchana1990).


