

What do 10,000 comic books—from Japanese manga and Korean webtoons to American superhero series and European albums—tell us about how the medium is produced, rated, and distributed? This post uses the Comic Books Dataset (10,000 entries) by Rudra Kumar Gupta on Kaggle—a structured catalog with titles, creators, studios, release years, formats, genres, page counts, ratings, status, and awards—to answer that question. We look at rating patterns, where comics come from, how format and color style break down, which genres dominate, how length relates to quality, and whether award-winning titles rate higher. The result is a data-backed snapshot of a global, multi-format industry.
The big picture
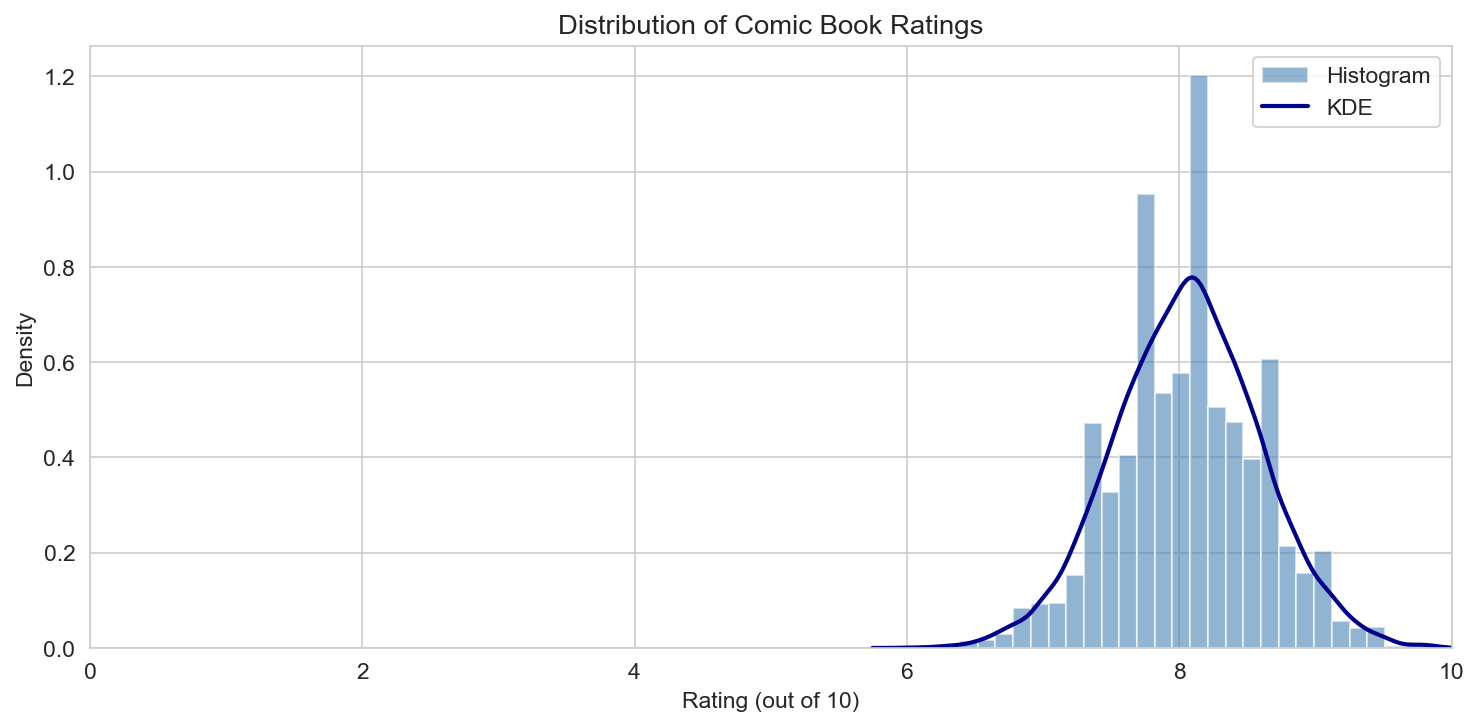
In this dataset, median rating is 8.1 out of 10 and the mean is about 8.06. The distribution is left-skewed: most titles sit in the 7.5–8.5 band, with a long left tail of lower ratings and a smaller share of 9+ titles. So by these ratings, the sample is generally strong—readers or critics tend to score comics in the upper range.
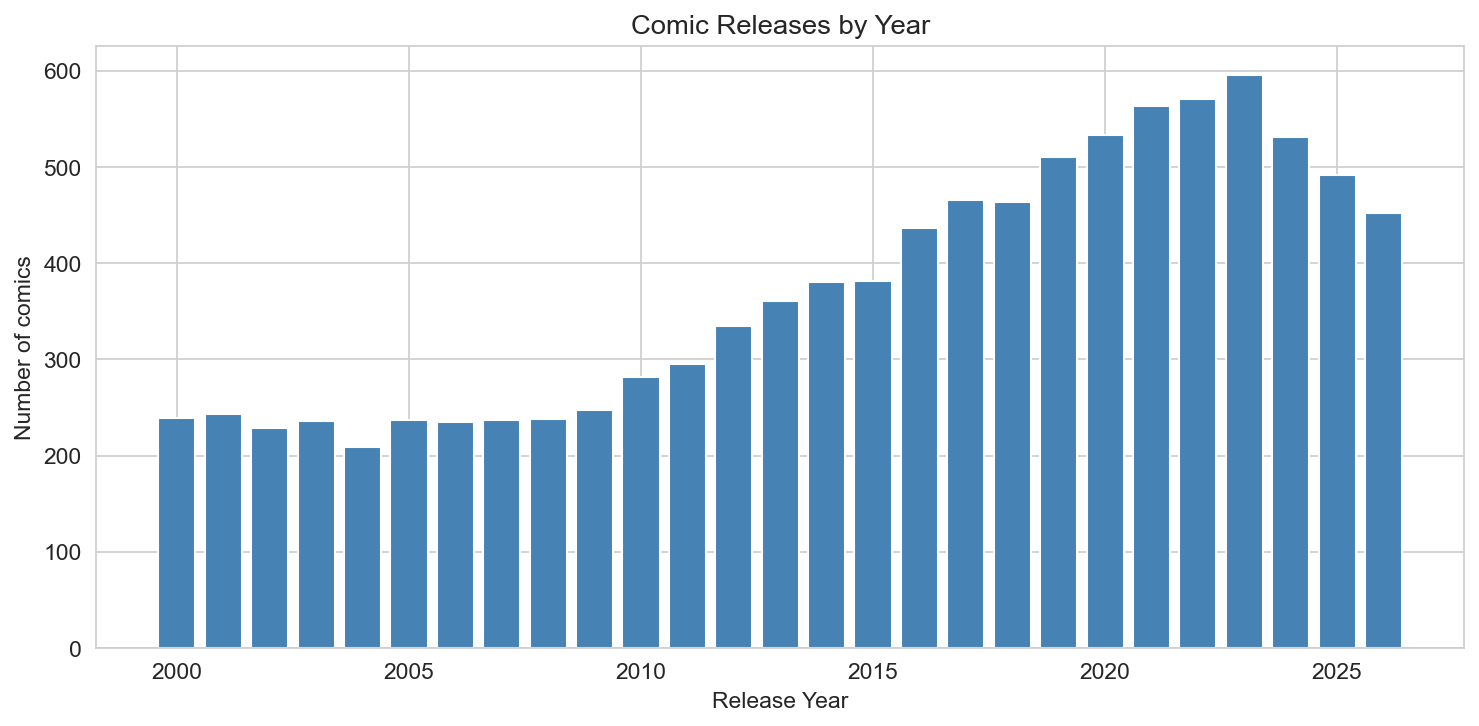
- Release years: Comics span 2000–2026, with steady output across years and no single peak; the catalog is a mix of older and recent work.
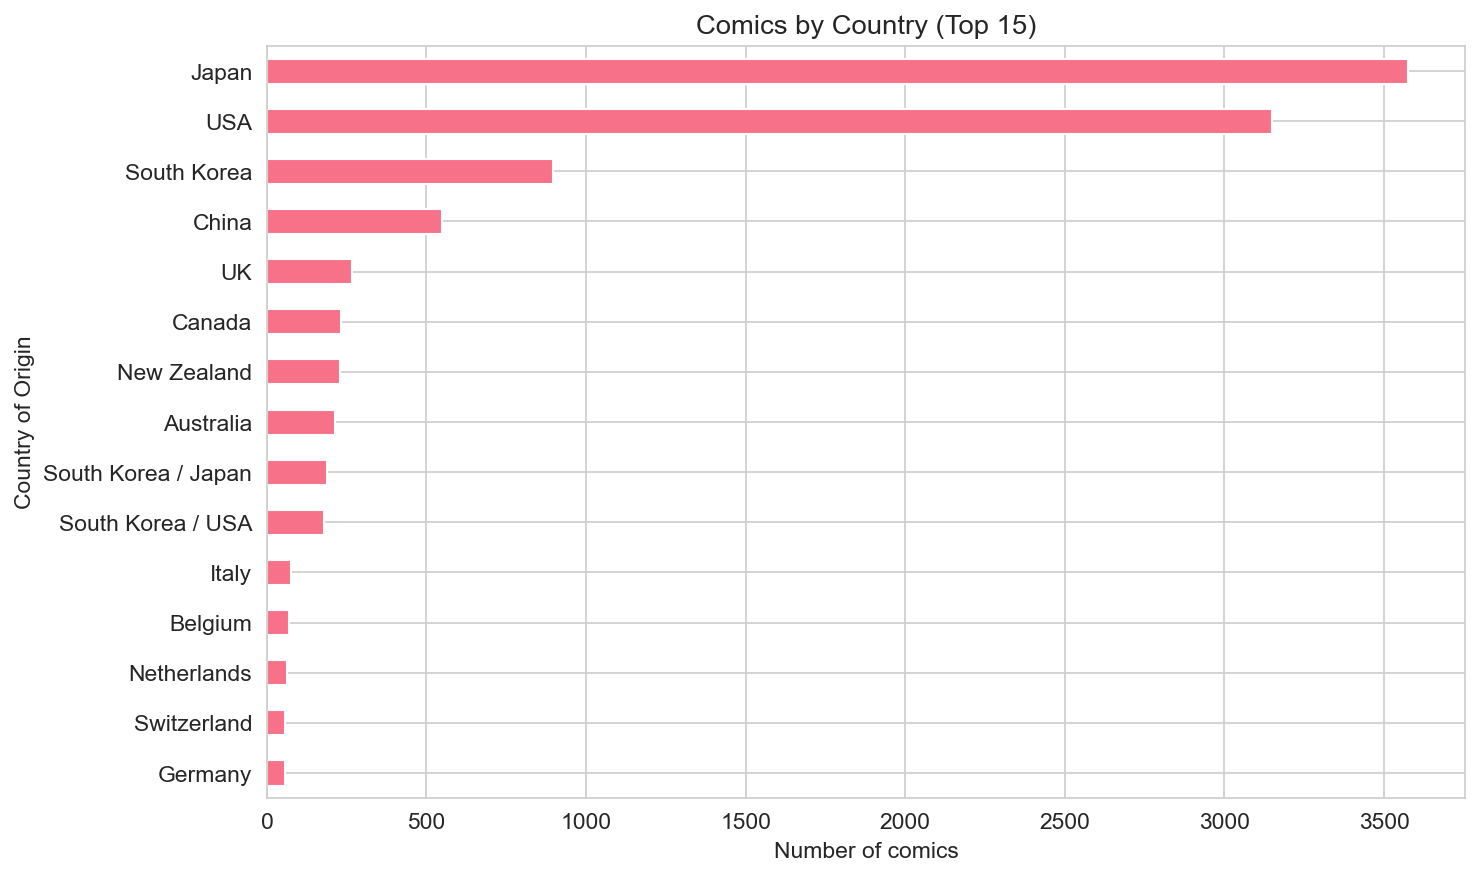
- Geography: Japan dominates by volume, followed by USA, South Korea, China, and UK. Together, manga (Japan), American superhero and indie comics, and Korean webtoons account for most of the 10,000 entries.
- Data scope: We use all 10,000 rows for counts and categories; for rating-based analyses we drop only rows with missing or invalid ratings. Page count and release year are coerced to numeric where possible, with missing values excluded per analysis.
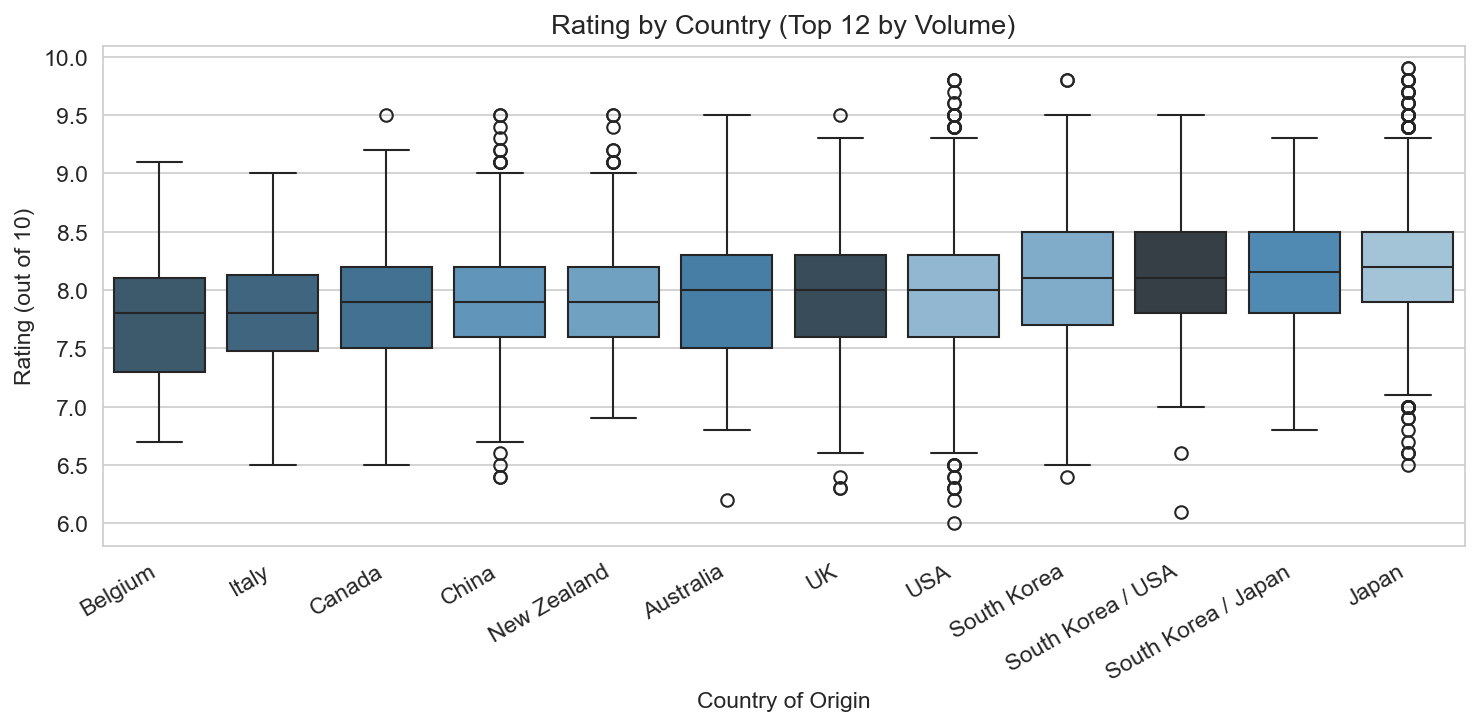
Rating by country (among the top 12 by volume) shows similar medians across major markets—most sit near or above 8. Japan, USA, South Korea, and others cluster in a narrow band, so high volume does not come with systematically lower or higher ratings in this sample.
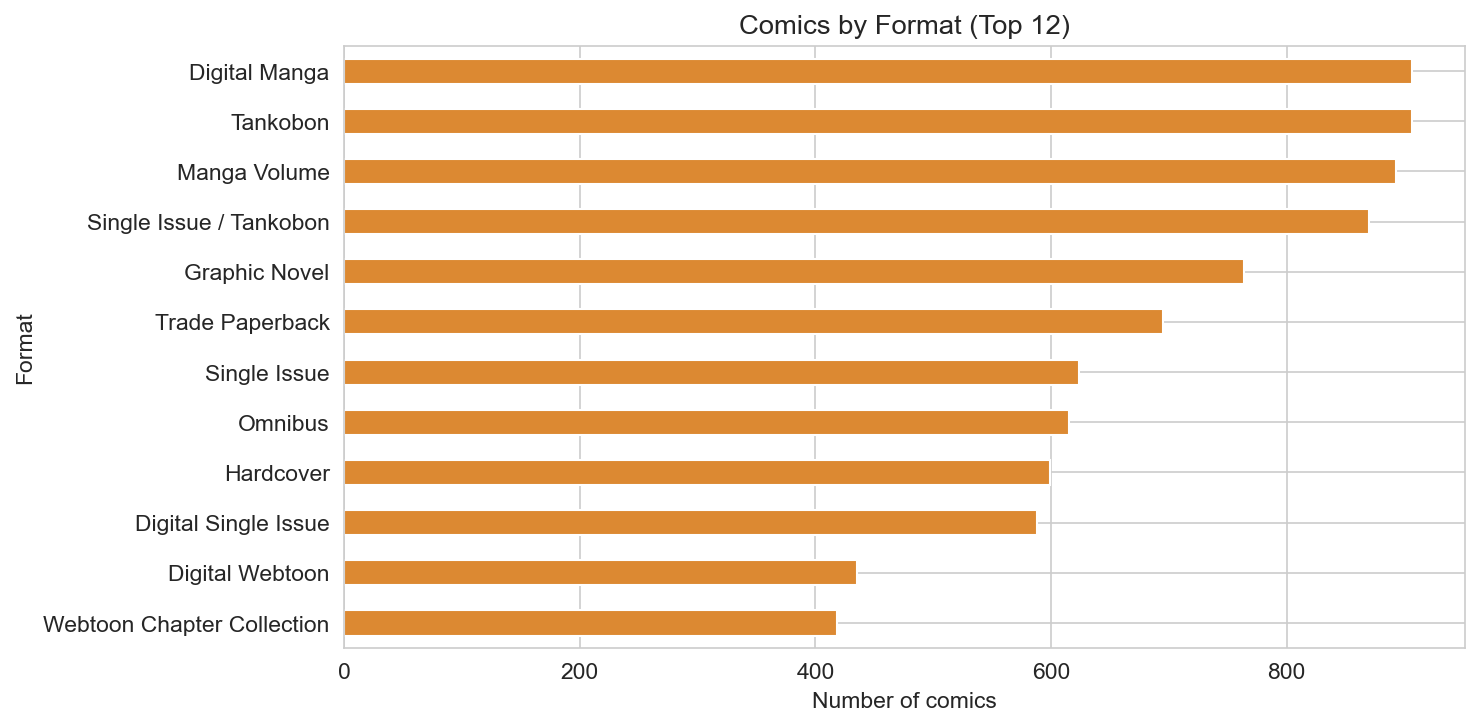
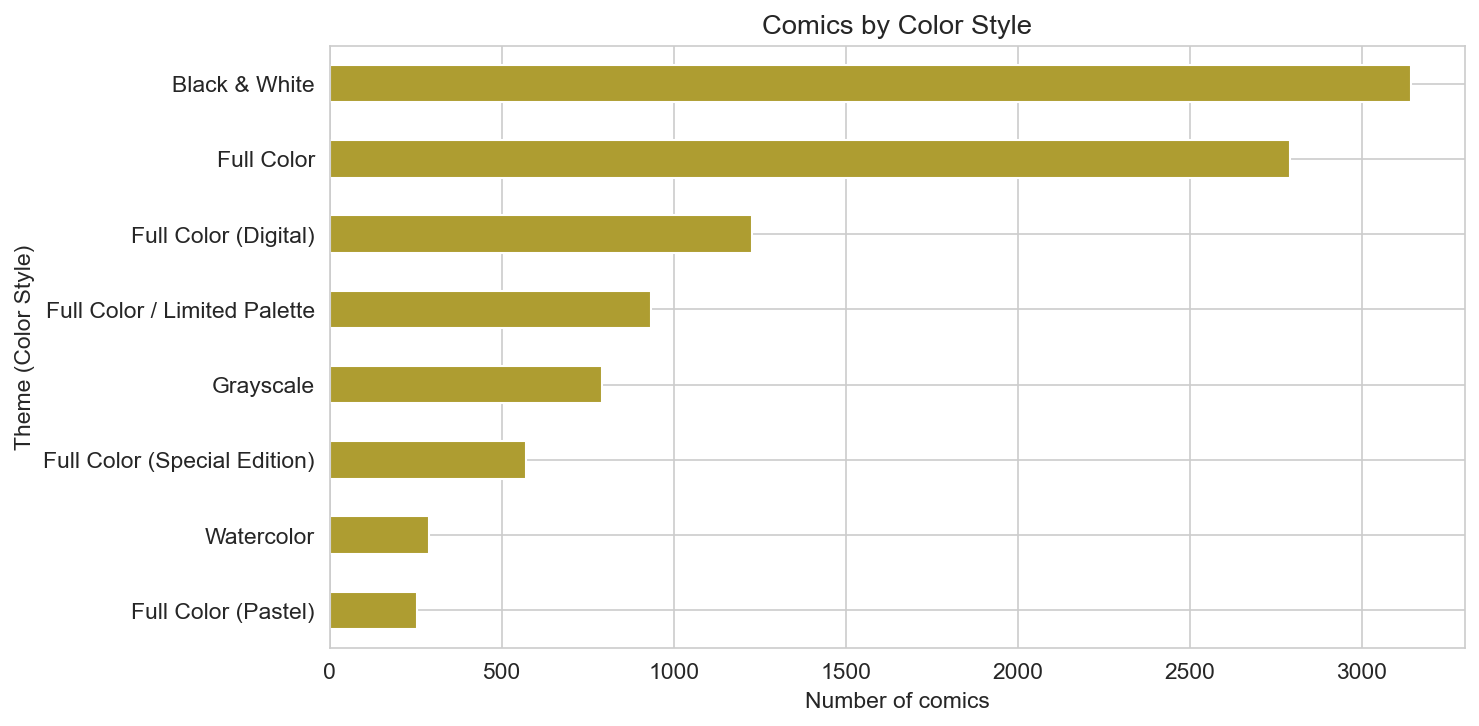
Formats and presentation
How comics are published—single issues, tankobon, webtoons, graphic novels—and how they are colored—black & white, full color, grayscale—reveal industry structure and reader expectations.
Format: Tankobon and Manga Volume lead, reflecting the weight of Japanese manga in the dataset. Graphic Novel, Single Issue, Webtoon, and Digital Manga (and related digital formats) also appear in large numbers. So the catalog is split between traditional print volumes (especially manga) and digital or web-first formats.
Theme (color style): Black & White is the most common style, again aligned with manga. Full Color and variants (e.g. Full Color Digital, Special Edition) follow, then Grayscale and Limited Palette. Color style is a strong differentiator between manga (often B&W) and Western or webtoon releases (often full color).
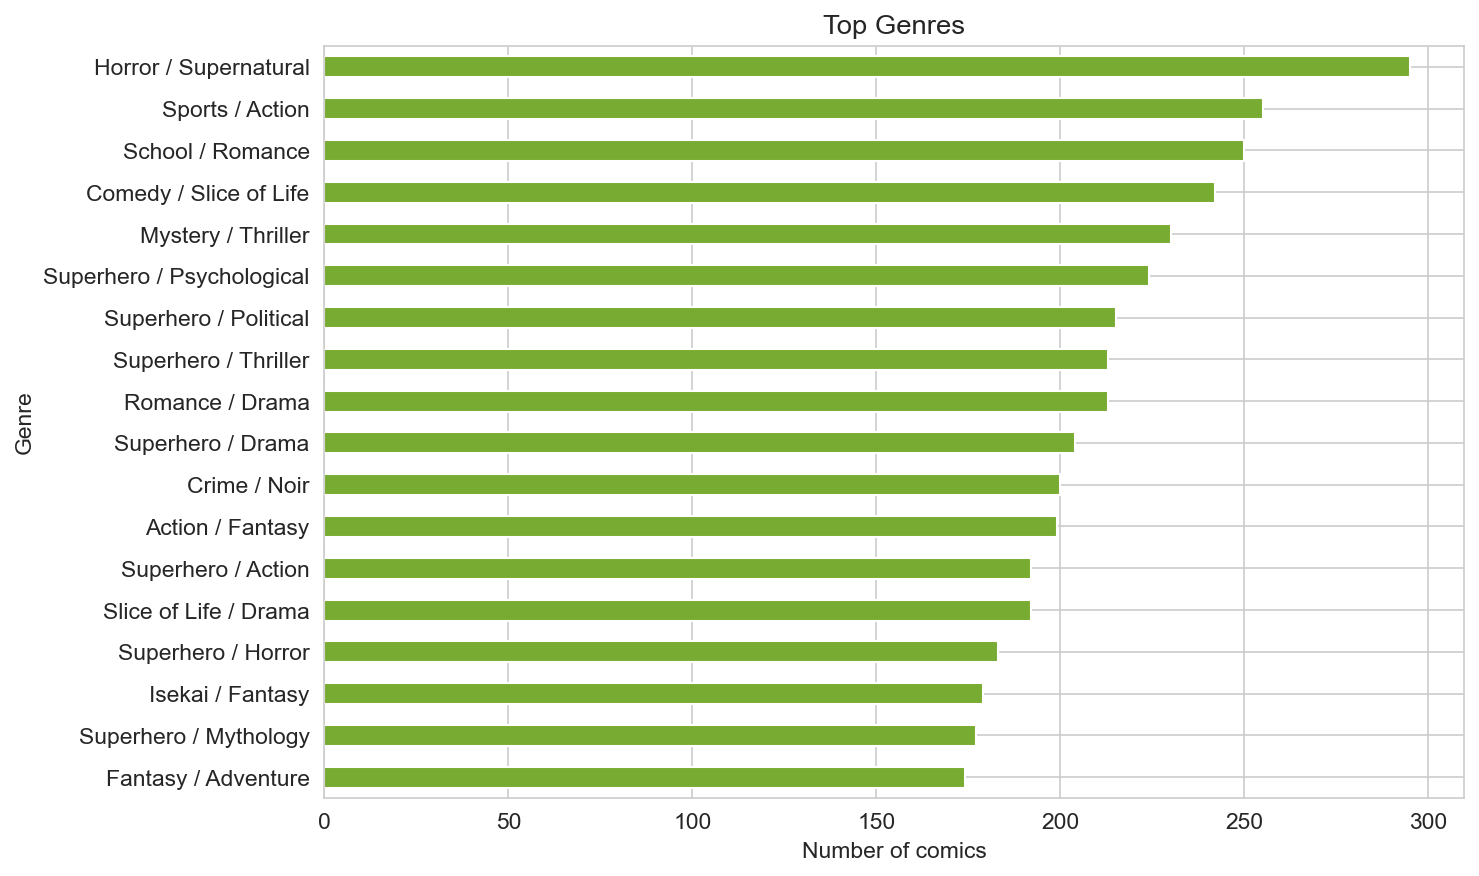
Genres and status
Genres are stored as compound labels (e.g. "Shoujo / Romance", "Action / Historical"). The top genres by count include Superhero (often with a subgenre like Thriller or Sci-Fi), Shoujo / Romance, Action / Fantasy, Slice of Life / Drama, and Romance / Comedy. So superhero and romance-driven titles (in both Eastern and Western traditions) dominate the sample.
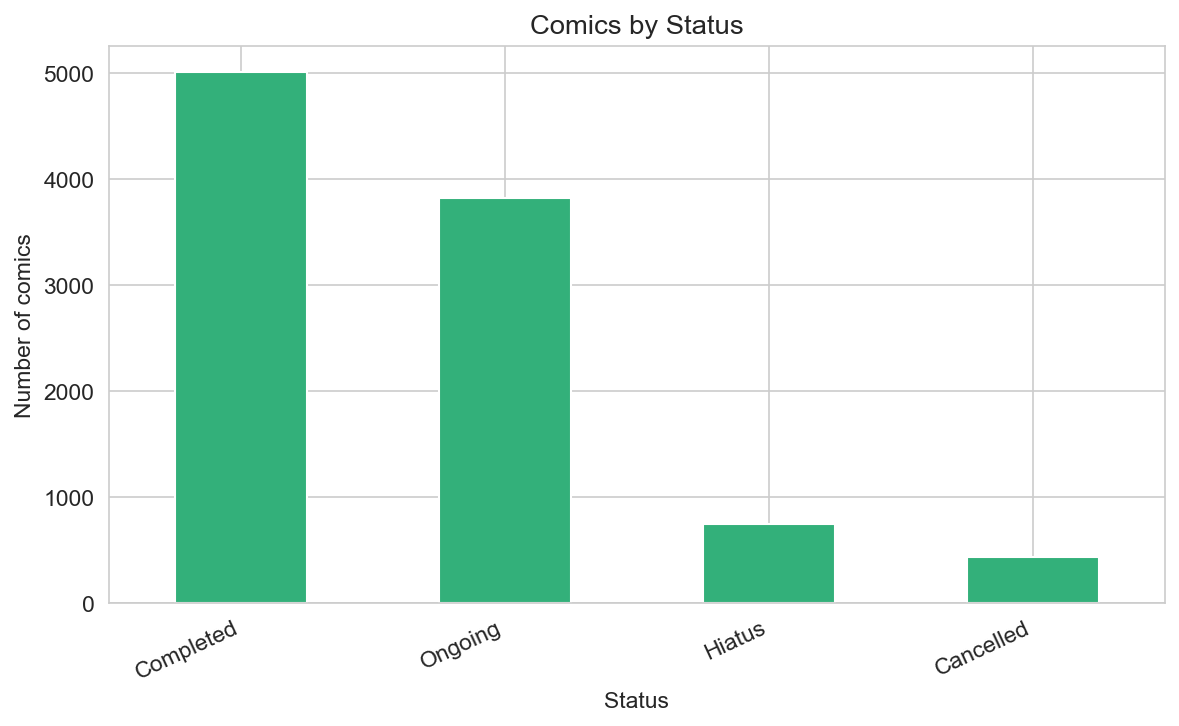
Status: About 50% of titles are Completed, 38% Ongoing, 7% Hiatus, and 4% Cancelled. So the dataset is a mix of finished series and works still in progress, which matters when interpreting volume counts and longevity.
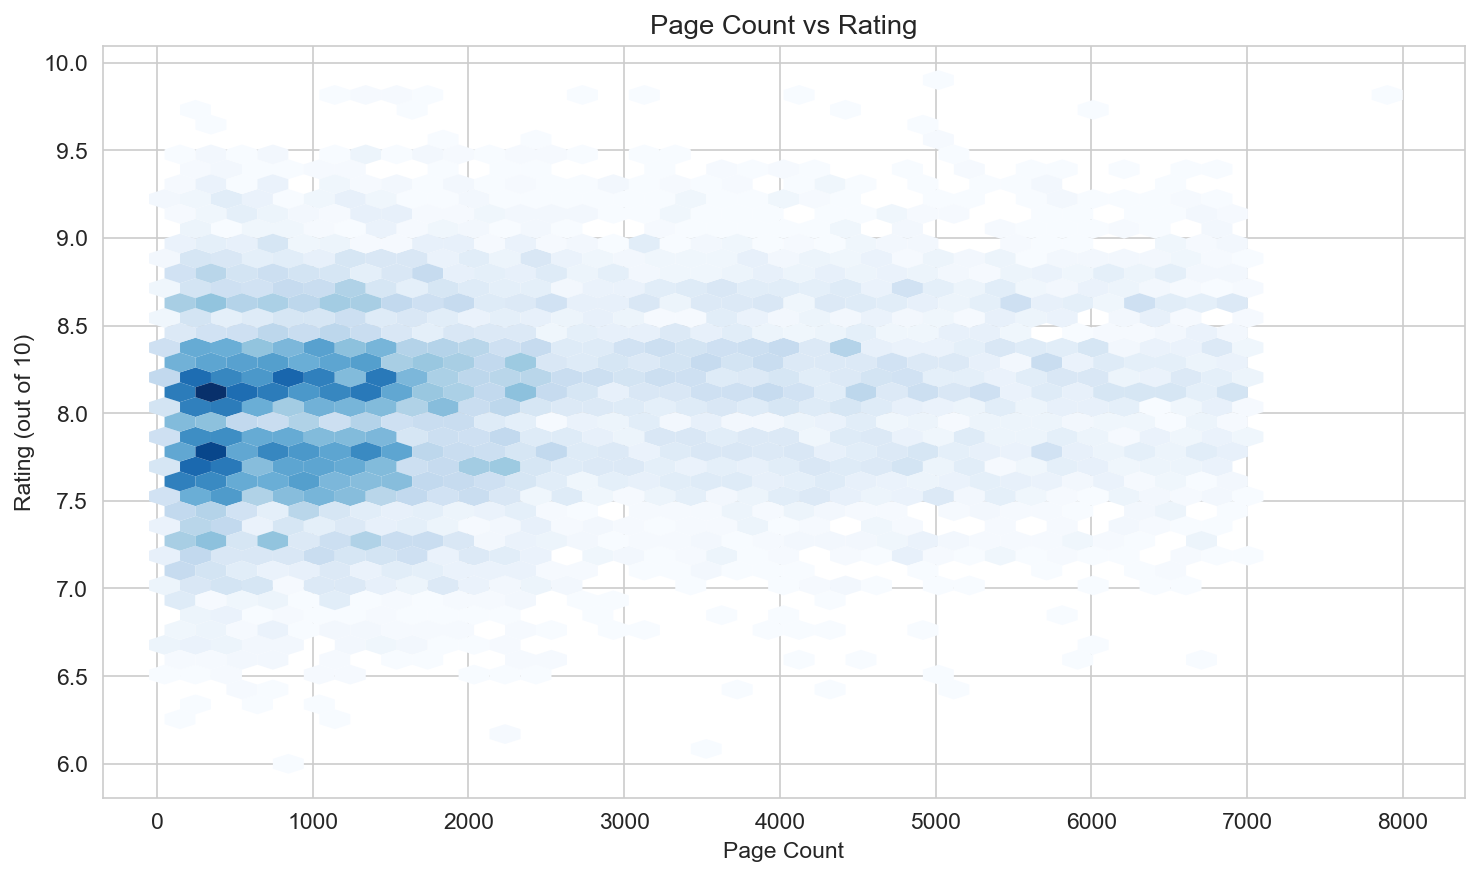
Length and quality
Does longer mean better? Page count in this dataset is highly variable—median around 1,571 pages, mean around 2,233—with many short works (single arcs or one-shots) and long-running series (thousands of pages).
The page count vs rating scatter (hexbin) shows a diffuse cloud: there is no strong linear relationship. Very long series are not systematically higher or lower rated; short and long titles both span the full rating range. So length alone does not predict rating in this sample.
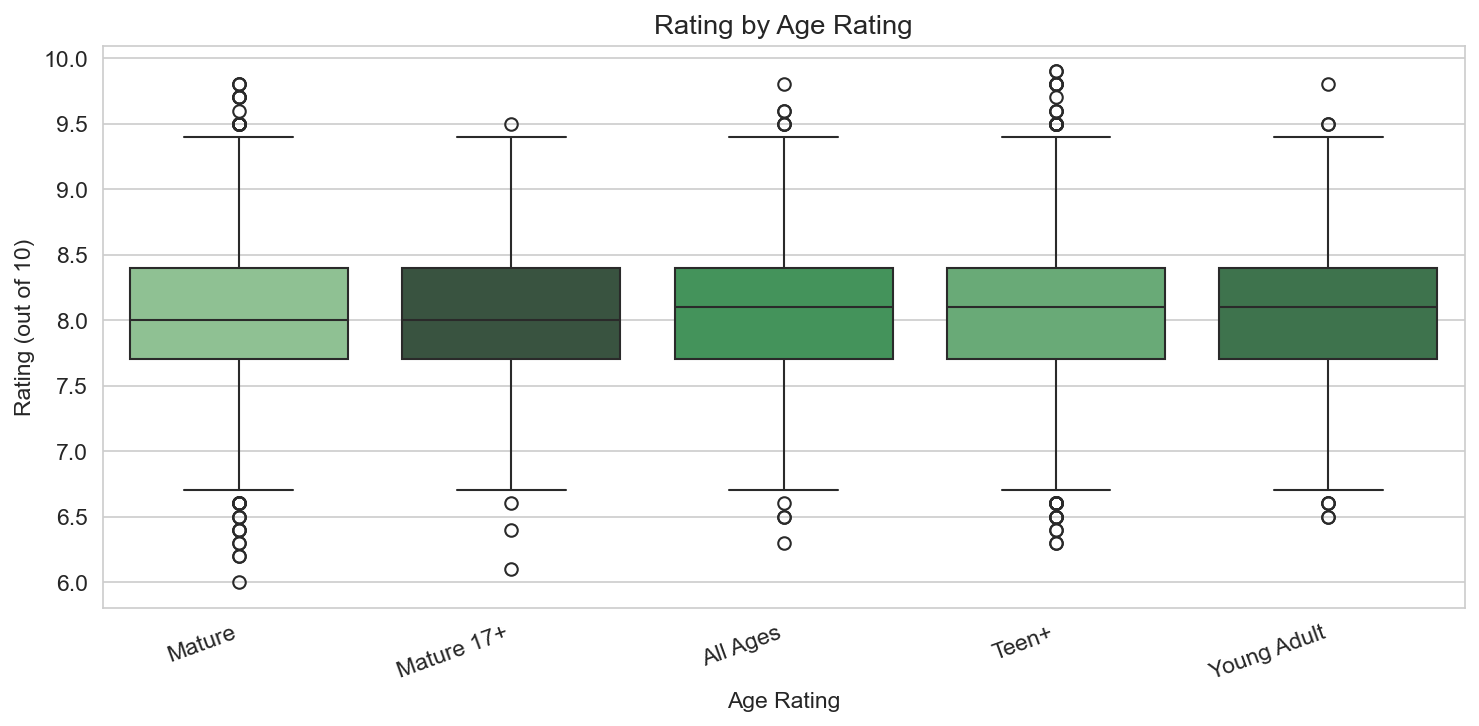
Age rating (All Ages, Teen+, Mature, etc.) groups show similar median ratings; no single age band clearly outperforms or underperforms. That suggests ratings reflect quality or appeal within each segment rather than a simple “mature = better” or “all-ages = better” pattern.
Awards and recognition
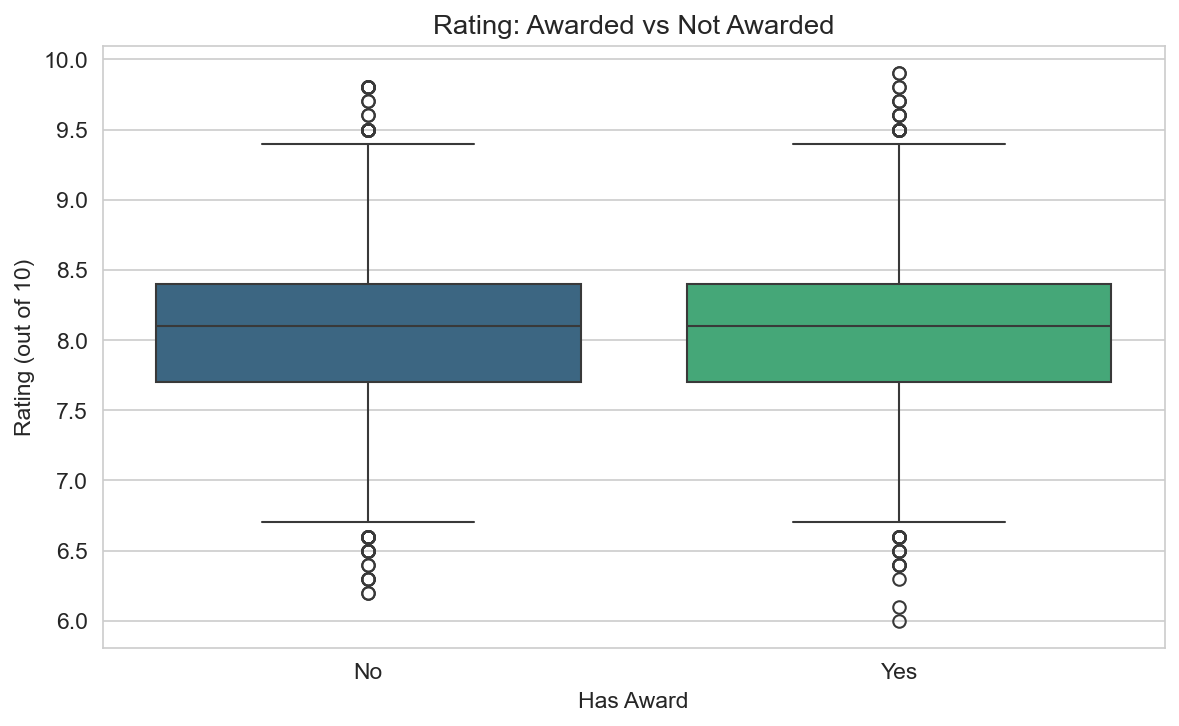
About 40% of titles have a named award (Eisner, Harvey, Manga Taisho, Japan Media Arts, etc.); the rest are None or missing.
Awarded vs not awarded: Median (and mean) rating is higher for awarded titles than for non-awarded ones. So in this dataset, award-winning comics tend to be rated higher—consistent with awards picking up quality or visibility that correlates with reader or critical scores. Causation is unclear (awards may drive visibility and thus ratings, or both may reflect the same underlying quality).
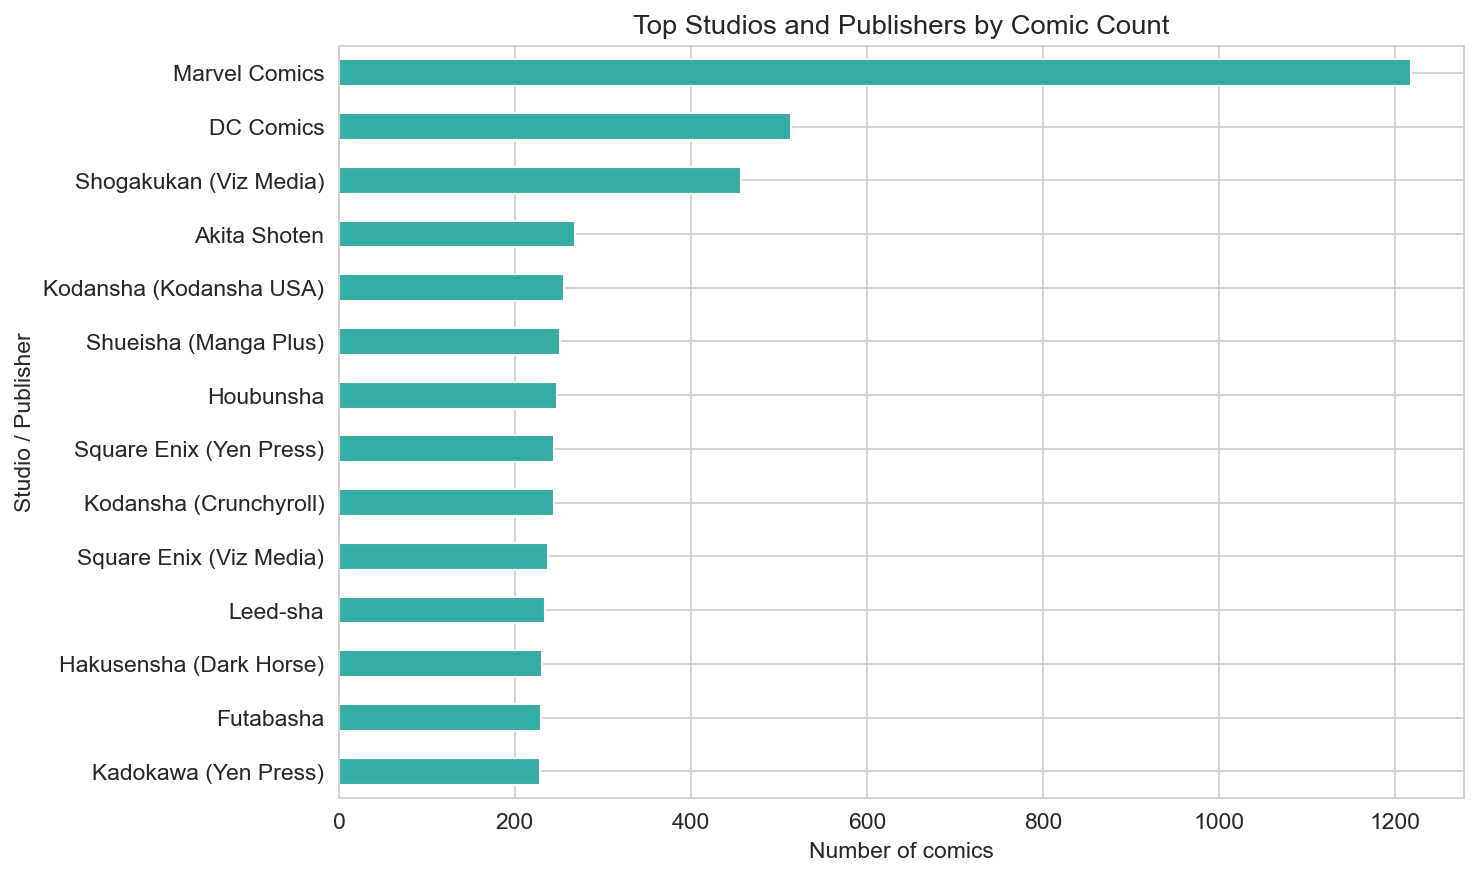
Who publishes what
Studios and publishers are concentrated: a small set of imprints accounts for a large share of the 10,000 titles. Marvel Comics, DC Comics, and major Japanese publishers (e.g. Shueisha, Kodansha, Shogakukan, often with Viz Media or Yen Press as local partners) appear at the top, alongside Webtoon and Kakao-related platforms for Korean manhwa. So the dataset reflects both traditional print powerhouses and leading digital platforms.
Practical takeaways
For readers
- Median rating 8.1 is a useful anchor; most titles in the sample sit in the 7.5–8.5 band. Use country and genre to narrow by taste (manga vs superhero vs webtoon).
- Page count does not predict rating; short and long series both span the full range. Choose by genre and status (Completed vs Ongoing) rather than length alone.
- Awarded titles rate higher on average; award lists can be a signal for “where to start” in a large catalog.
For creators and publishers
- Format and color align with region: B&W dominates manga; full color dominates many Western and webtoon releases. Matching format to audience expectations matters.
- Status mix (half Completed, 38% Ongoing) suggests the dataset is a living catalog; tracking completion and hiatus helps set expectations.
- Publisher concentration implies visibility is tied to a few large players; indie or smaller imprints appear but with lower counts.
Conclusion
The 10,000-comic dataset paints a global, multi-format picture: strong average ratings, dominance of Japan and the USA by volume, a mix of print and digital formats, and a genre landscape led by superhero and romance-driven titles. Length does not predict rating; awards do correlate with higher ratings. Whether you are exploring for the next read or curious about how the industry looks in data, this analysis offers a structured, visual starting point.
Data and methodology
- Source: Comic Books Dataset (10,000 entries) by Rudra Kumar Gupta on Kaggle. Columns include comic_id, Title, Writer, Artist, Studio/Publisher, Release Year, Format, Theme (Color Style), Genre, Country of Origin, Page Count, Rating (out of 10), Status, Language, Age Rating, Awards, Volume Count.
- Cleaning: Release Year, Page Count, Rating, and Volume Count were coerced to numeric; missing or invalid ratings were dropped for rating-based analyses. All 10,000 rows were used for counts (country, format, genre, status). Awards were treated as “Awarded” if non-missing and not the string "None".


