

This post uses the AI Chips, Energy and Nuclear Index 2026 dataset (Kaggle: AI Chips, Energy and Nuclear Index 2026) to run a full research pass on 45,925 daily records from October 2020 through January 2026, covering 37 tickers across Semiconductors, Software, Utilities, Commodities, Energy, Hardware, and related sectors. We analyze sector rotation between high-growth Tech and defensive Utilities during volatile periods, lead-lag correlations between commodity (Copper, Uranium) and semiconductor returns, volatility in “AI” names versus stable Utilities/Energy, and technical strategy backtests using the pre-calculated RSI_14 and SMA 50/200 crossovers. A short data and methodology note appears at the end.
Data overview
The dataset contains 45,925 rows (date–ticker pairs) from 15 October 2020 to 15 January 2026, with columns: Date, Ticker, Sector, Industry, Role, Close, Volume, Daily_Turnover, Log_Returns, Volatility_20d, RSI_14, SMA_50, and SMA_200. There are 9 sectors (e.g. Semiconductors, Software, Utilities, Commodities, Energy, Hardware, Semi Equipment, Industrials, Networking). Numeric fields were parsed and missing values dropped for analysis; each ticker has a full history over the date range.
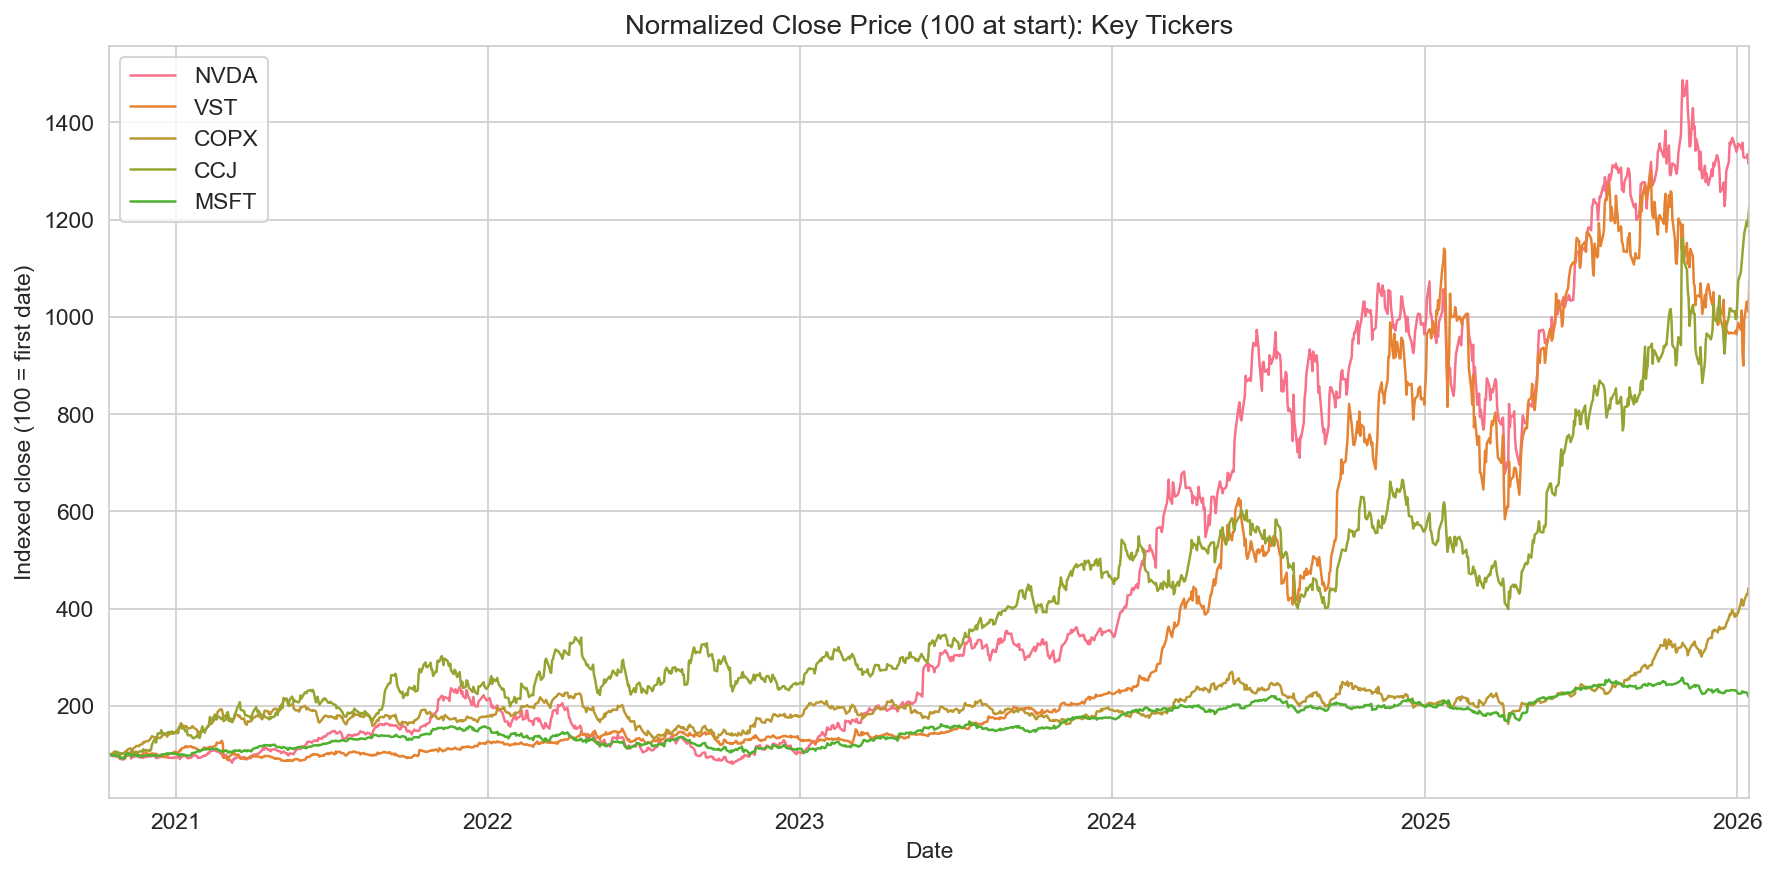
The normalized close chart (above) indexes five representative names to 100 at the start of the sample: NVDA (AI training hardware) and MSFT (software) show strong growth over the period; VST (utilities) and COPX (copper) are relatively stable; CCJ (uranium) rises later in the sample. This sets the stage for comparing Tech vs defensive performance and for supply-chain-style lead-lag tests.
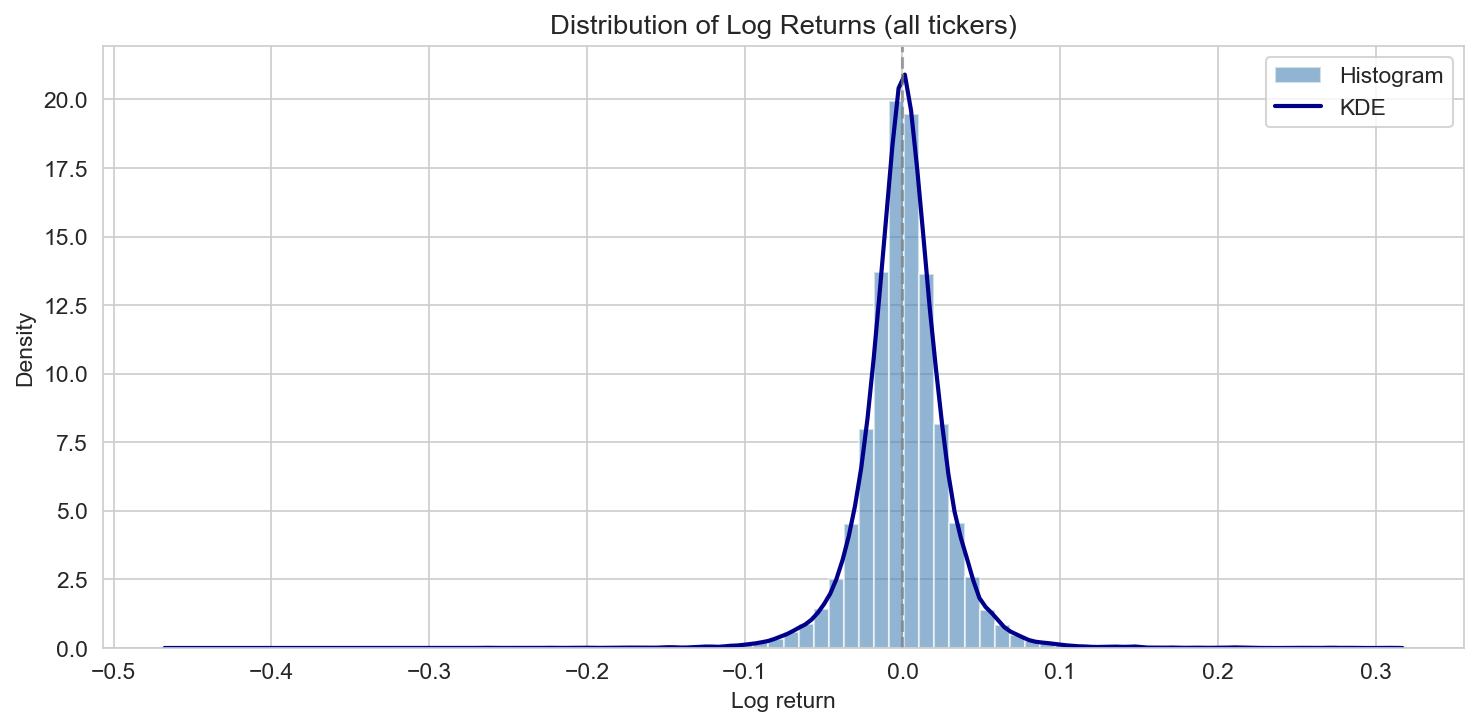
- Returns: Log_Returns are roughly symmetric around zero with fat tails; the returns distribution (histogram and KDE) below shows most moves in a narrow band with occasional large moves.
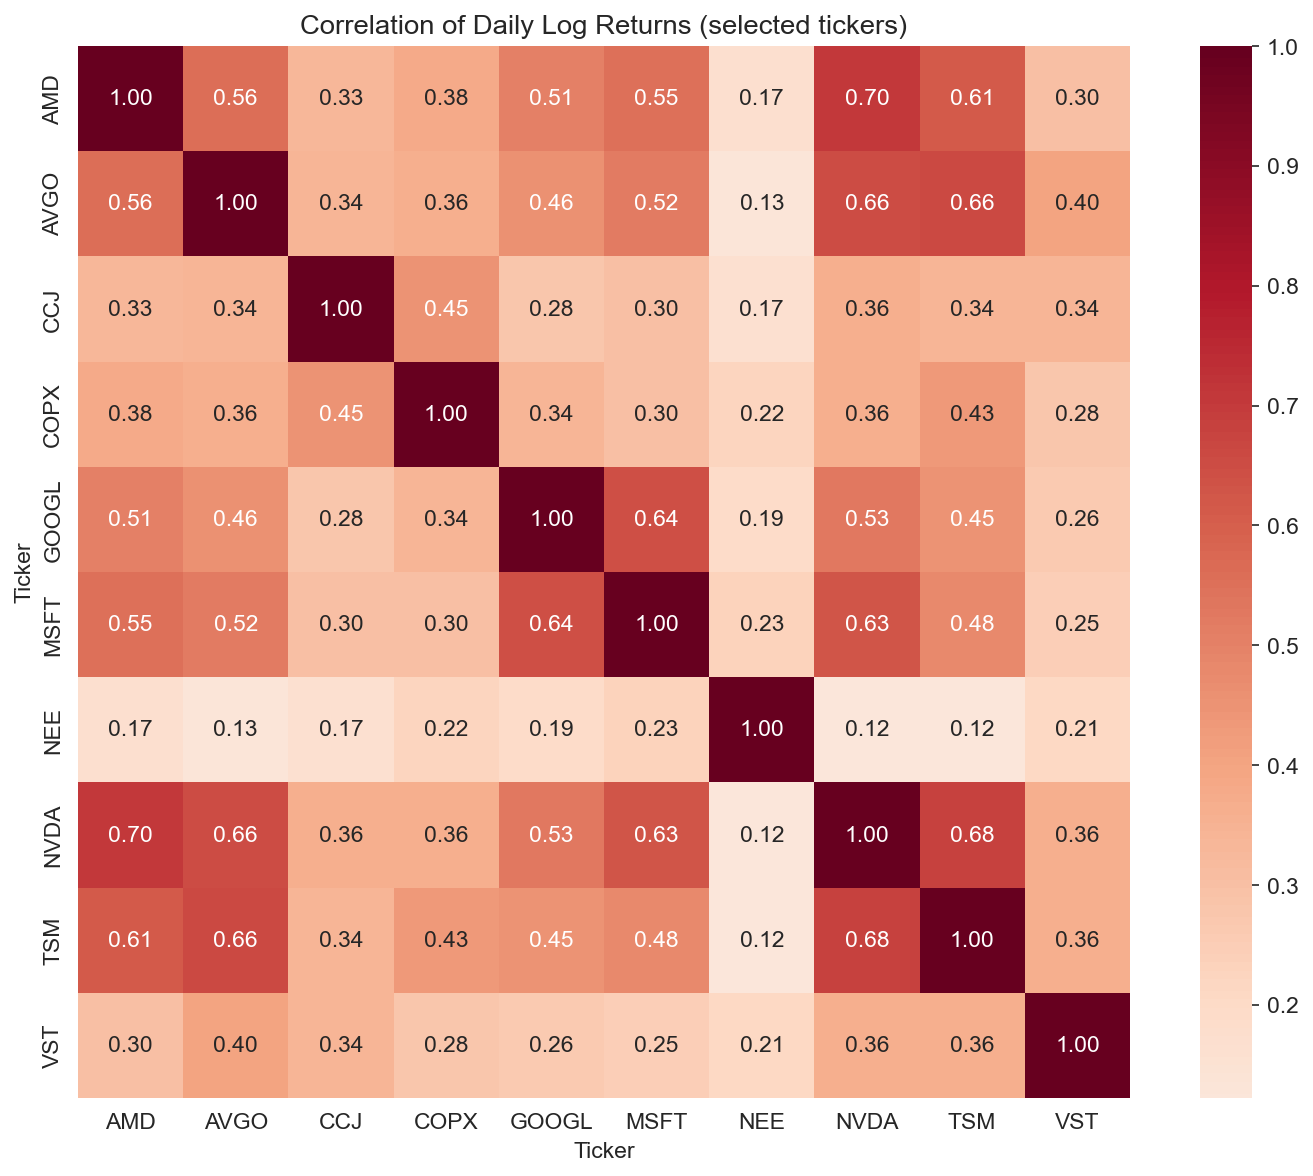
- Correlation: The correlation heatmap of daily log returns across selected tickers shows positive correlation within Tech (NVDA, AMD, MSFT, GOOGL) and within Utilities (VST, NEE); commodities (COPX, CCJ) can be less correlated with semis, offering diversification.
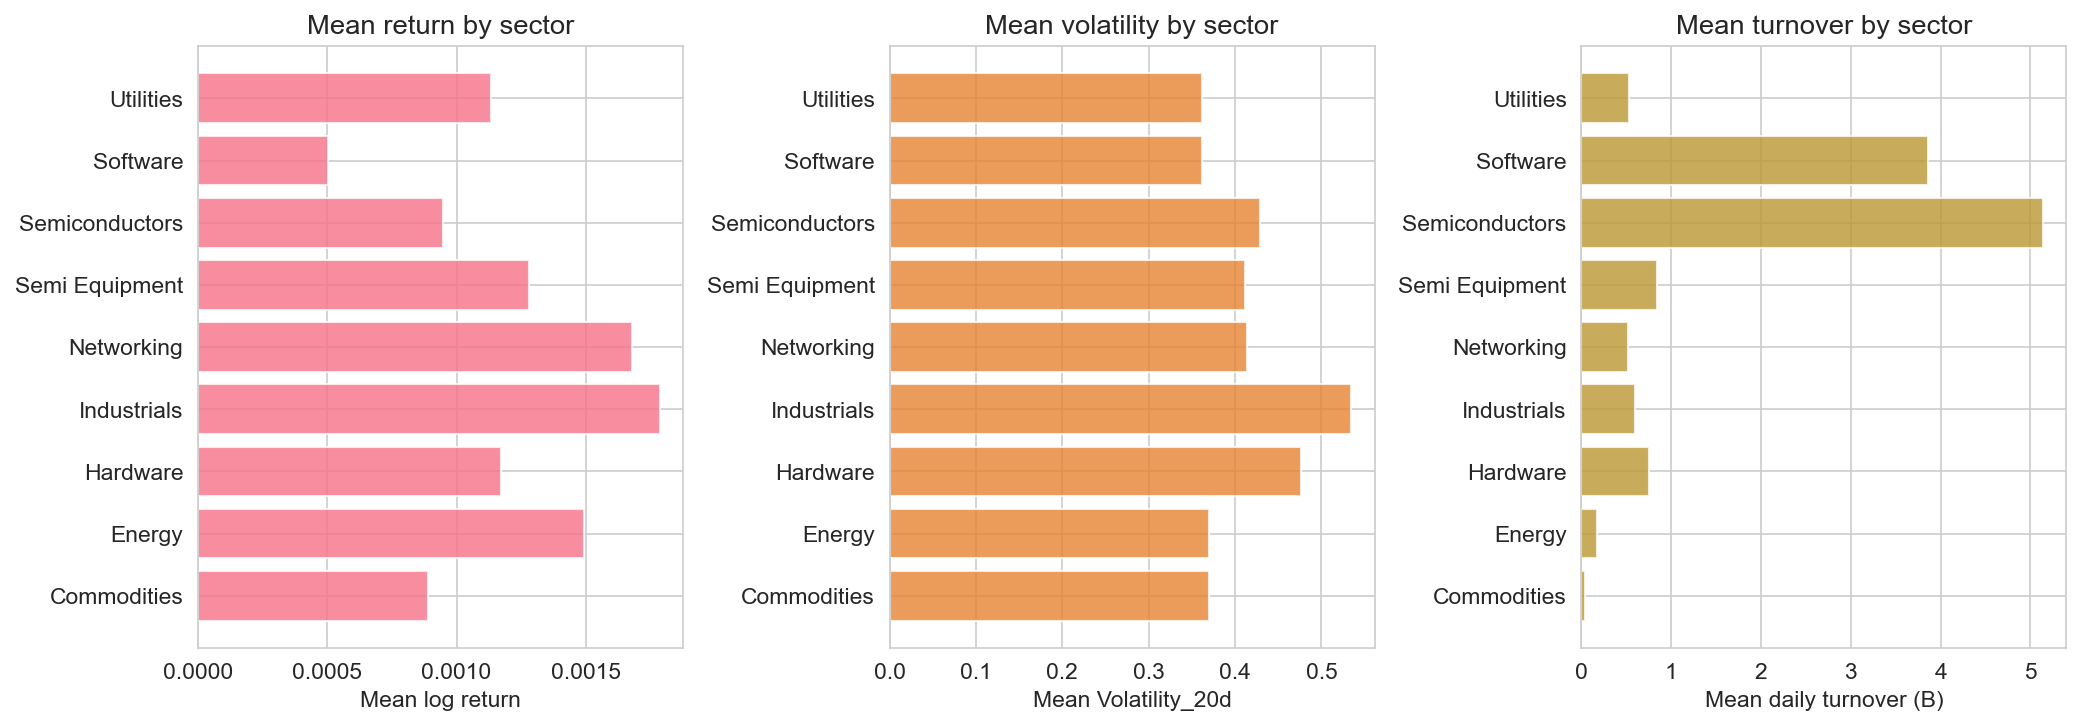
Sector summary (bar charts): mean log return, mean Volatility_20d, and mean daily turnover (in billions) vary by sector. Semiconductors and Software tend to show higher volatility and turnover; Utilities and some Commodities are relatively lower vol. These aggregates support the narrative that capital and risk are concentrated in Tech and that Utilities behave as a more stable segment.
Sector rotation: Tech vs Utilities
We quantify relative performance between a Tech basket (NVDA, AMD, MSFT, GOOGL) and a Utilities basket (VST, NEE, CEG) over the sample. For each date we take the average log return across tickers in the basket (after aligning to common dates), then compound to cumulative return indices set to 100 at the start. High-volatility regimes are defined as dates when market-wide average Volatility_20d is above the 75th percentile; we shade those periods in gray.
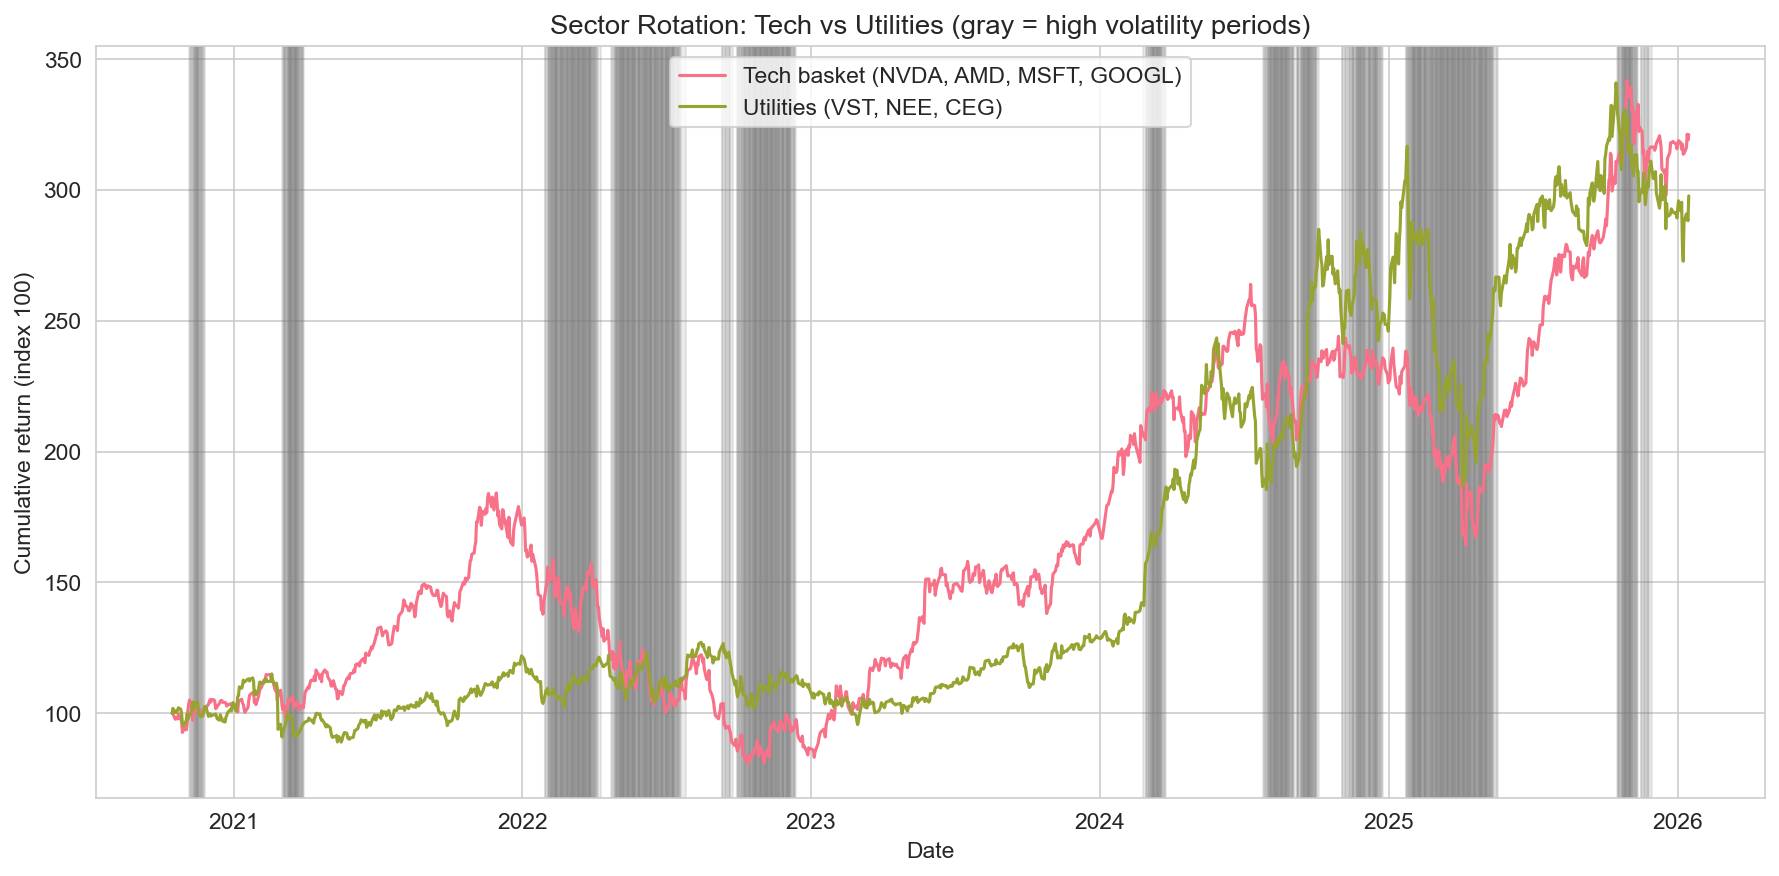
Tech substantially outperforms Utilities over the full period: the Tech index rises to a multiple of the starting level while Utilities drift up more modestly. During high-volatility windows (gray bands), both series can draw down; in some of those episodes Utilities hold up relatively better, consistent with defensive rotation, but the dominant effect in this sample is the long-run outperformance of Tech.
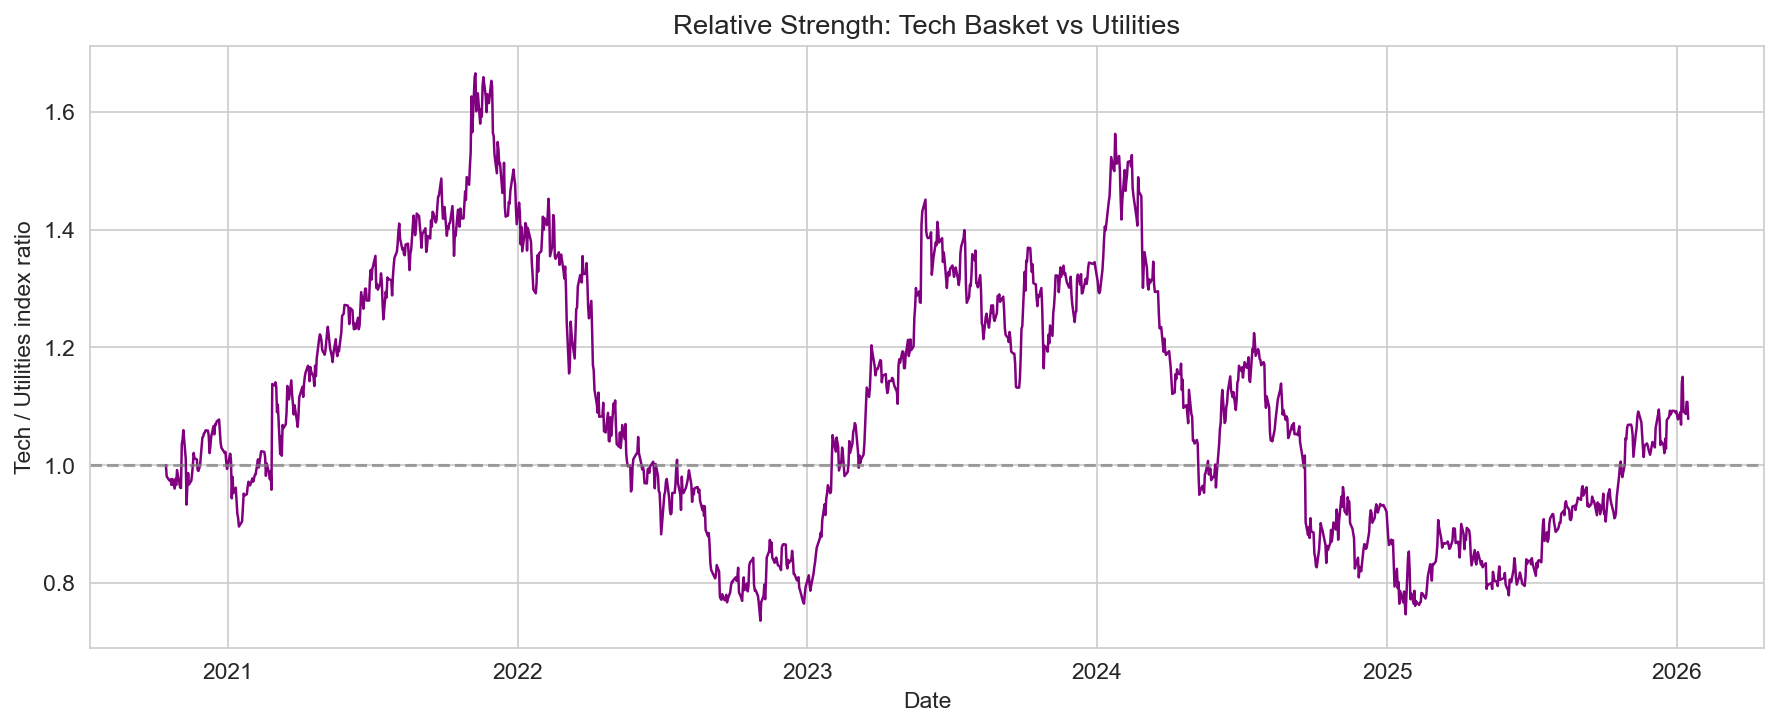
Relative strength (Tech index divided by Utilities index) makes the divergence explicit: the ratio trends up over time, with pullbacks during volatile spells. So in aggregate, capital did not persistently rotate from Tech into Utilities for long; instead, Tech led on the upside with Utilities offering a lower-beta, lower-return profile.
Lead-lag: Do commodities lead semiconductors?
We test whether Copper (COPX) or Uranium (CCJ) returns move before semiconductor leader NVDA (supply chain narrative: commodity prices or demand signals leading chip names). We compute cross-correlation of daily log returns for lags from −20 to +20 trading days; positive lag means the first series (commodity) leads the second (NVDA).
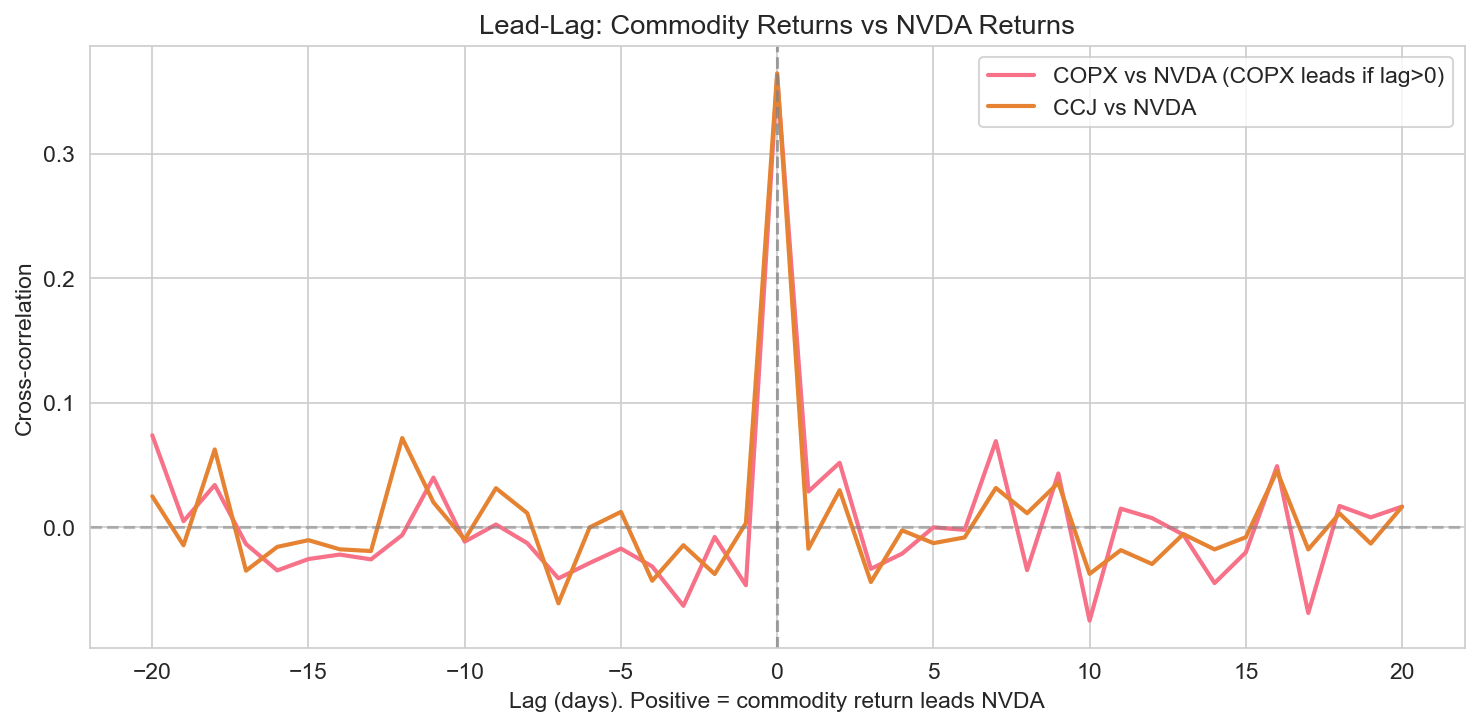
In this sample, the peak correlation occurs at lag 0 for both COPX–NVDA and CCJ–NVDA: returns are most correlated contemporaneously. There is no strong evidence in these cross-correlations that COPX or CCJ consistently leads NVDA by several days. That could mean (a) information is incorporated in both markets within the same day, (b) the relationship is driven by common factors (e.g. risk-on/risk-off) rather than a clear commodity→semiconductor causal lag, or (c) a longer horizon or different specification would be needed to detect a lead. The figure is still useful for showing that commodity and semiconductor returns are related and that the relationship is strongest same-day.
Volatility: AI names vs stable grids
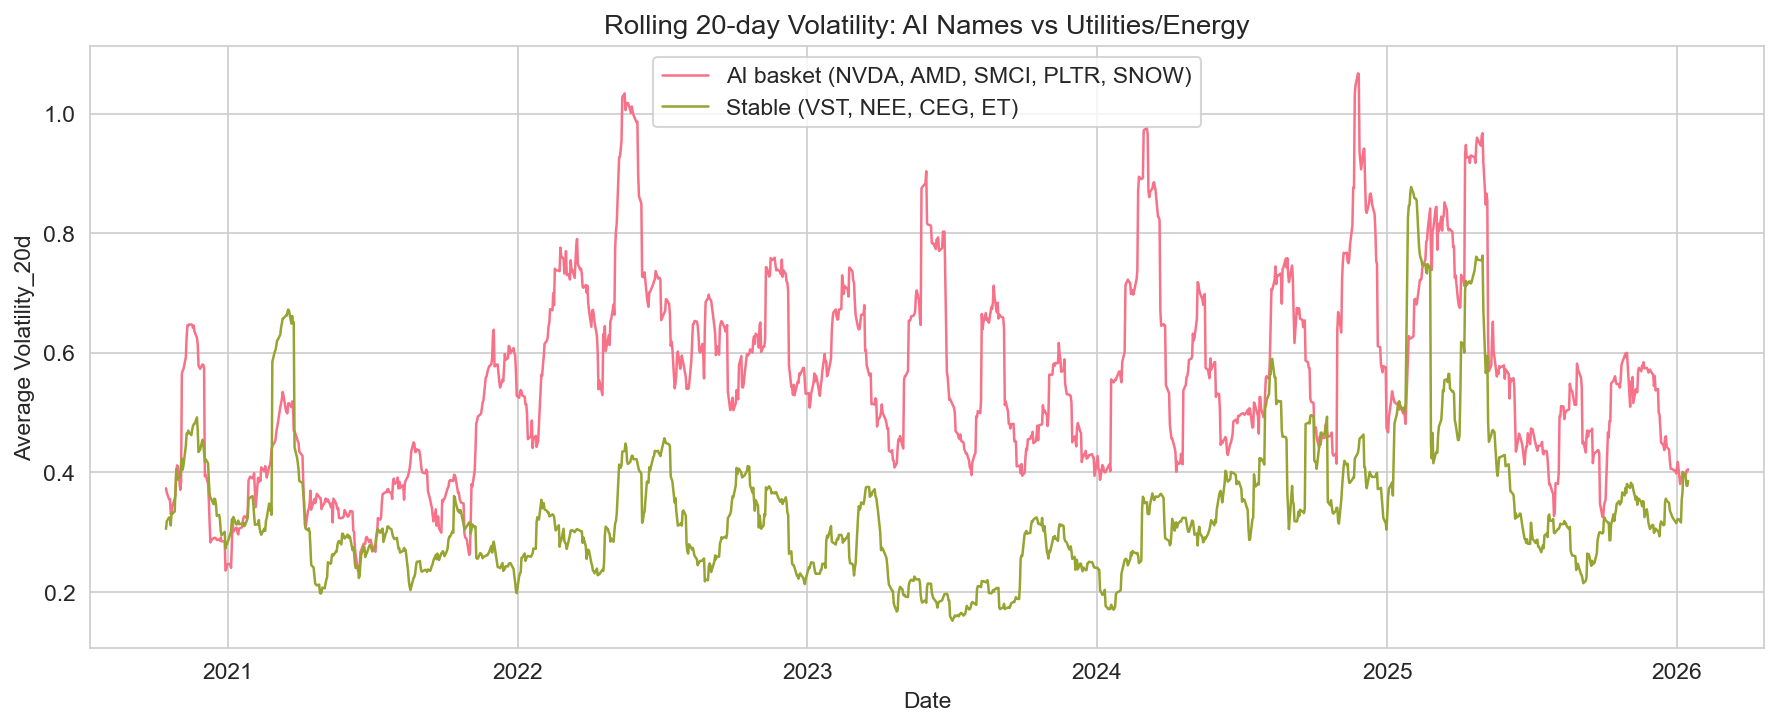
We compare Volatility_20d (pre-calculated 20-day rolling volatility) between an AI/Tech group (NVDA, AMD, SMCI, PLTR, SNOW) and a Stable group (VST, NEE, CEG, ET — utilities and energy). Over time, the average Volatility_20d of the AI basket is higher and more spiky than that of the Stable group; during stress periods (e.g. 2022, parts of 2024–2025) the gap widens. So “AI bubble” names exhibit risk clustering relative to stable grid/utility names.
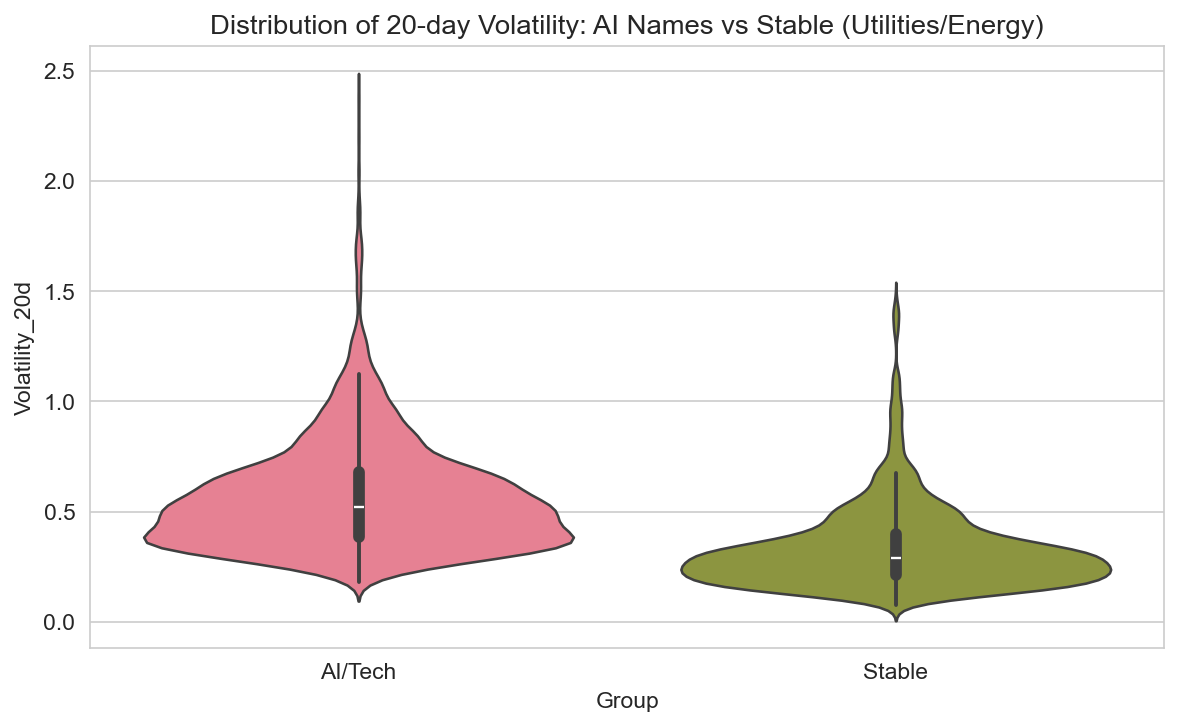
The violin plot of Volatility_20d by group shows the full distribution: AI/Tech has a higher median and a longer upper tail than Stable, consistent with higher and more variable risk in AI names. Investors seeking lower volatility exposure might tilt toward the Stable basket; those seeking growth accept higher vol in the AI basket.
Technical strategy backtest
We implement two simple rule-based strategies using the dataset’s RSI_14, SMA_50, and SMA_200:
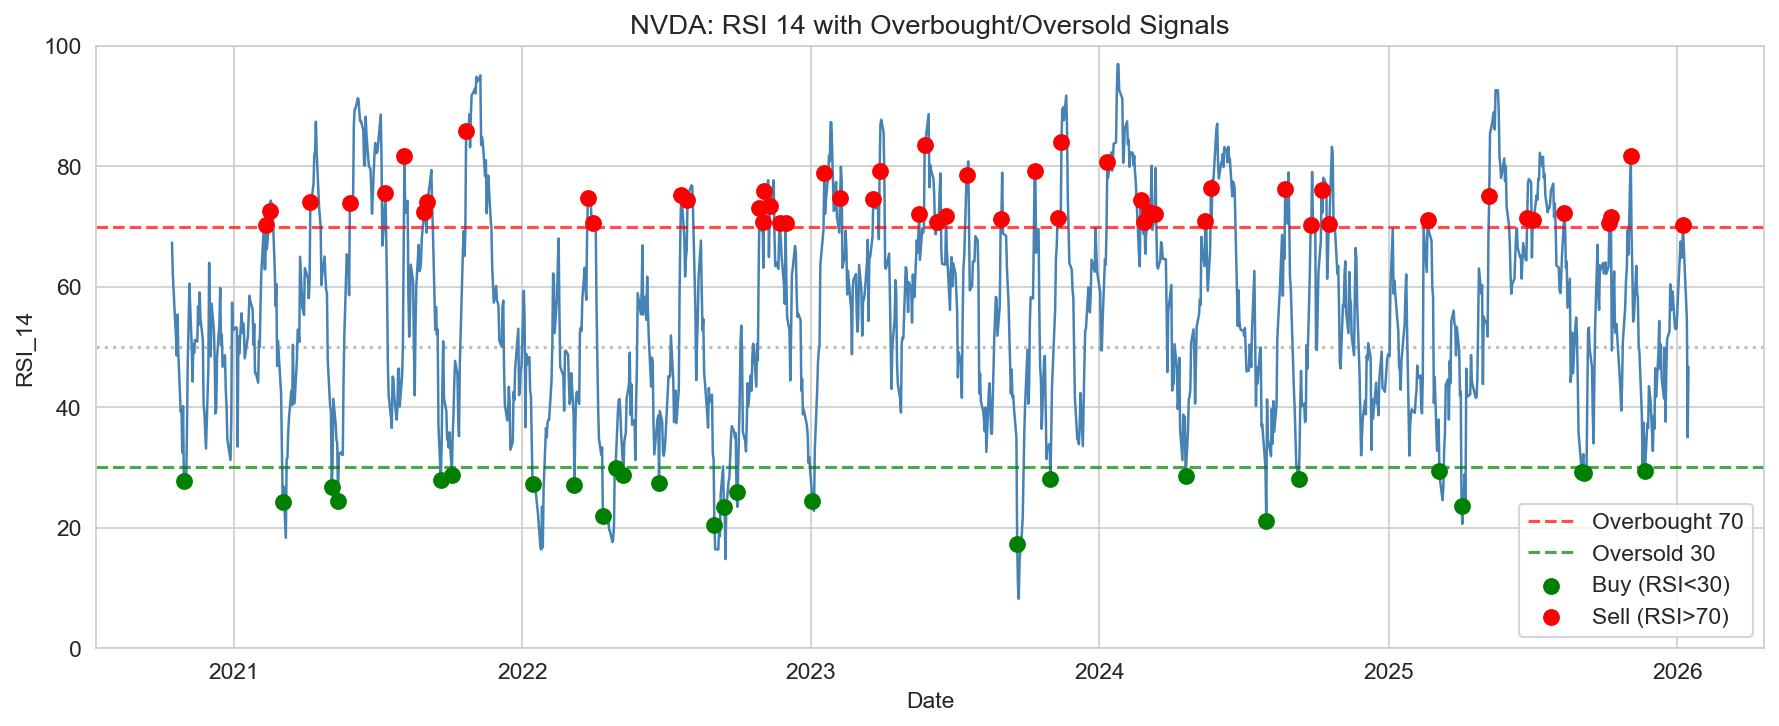
- RSI strategy: Buy when RSI_14 crosses below 30 (oversold), sell when it crosses above 70 (overbought). Position is either long or flat.
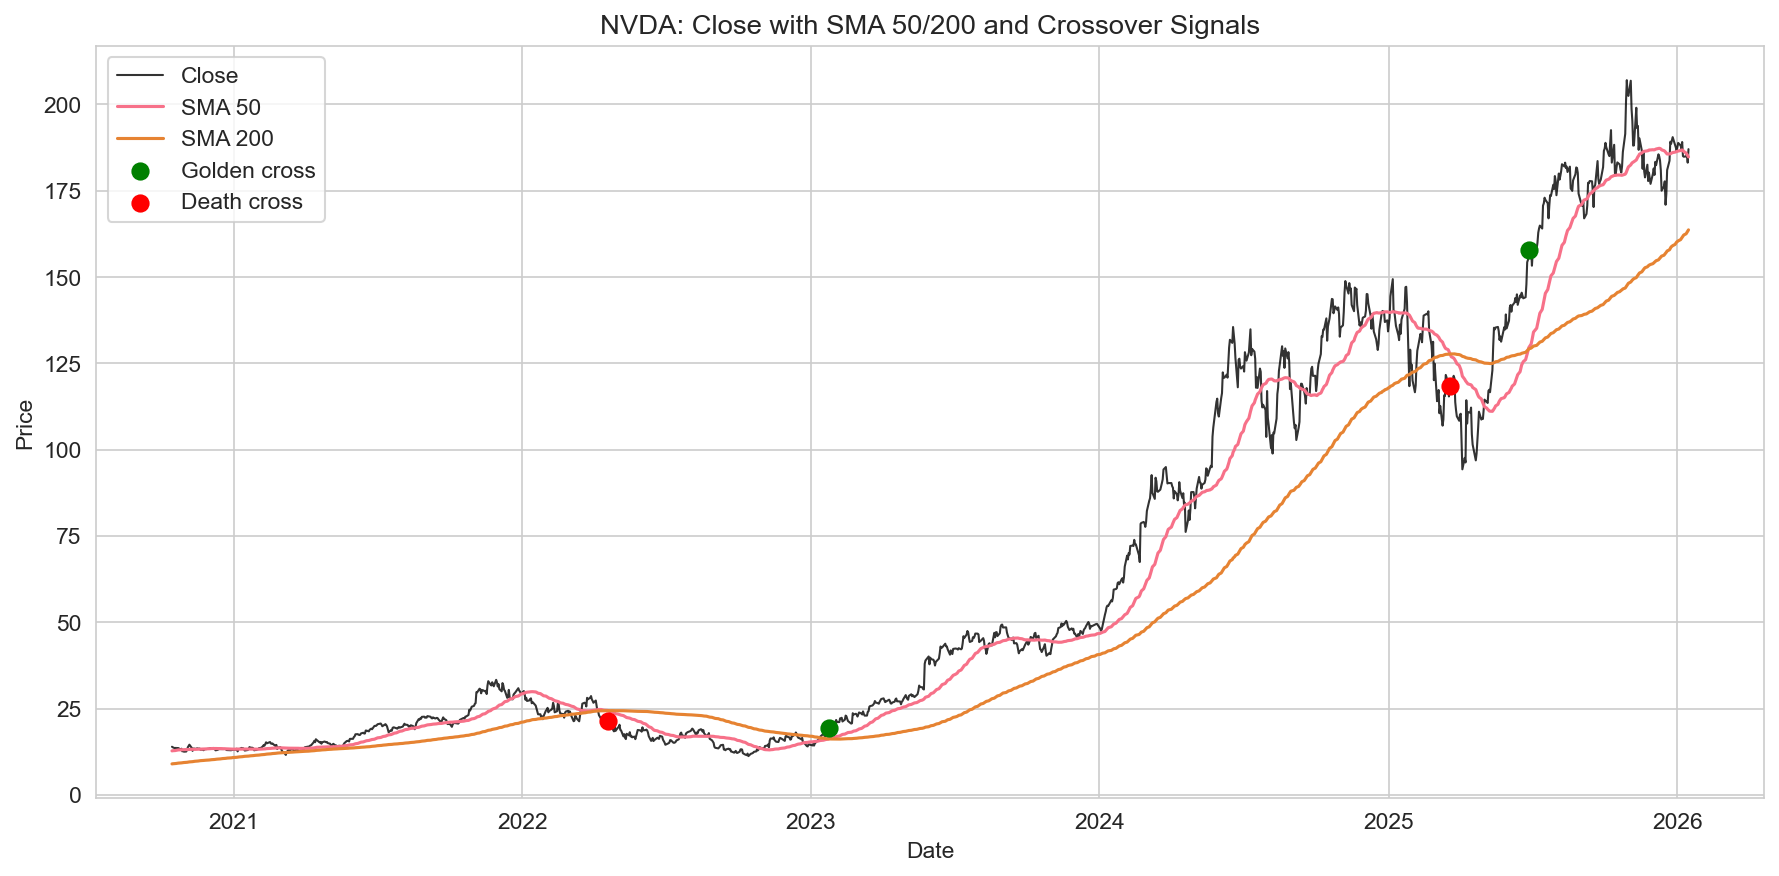
- SMA crossover: Go long on a golden cross (SMA_50 crosses above SMA_200), exit on a death cross (SMA_50 crosses below SMA_200).
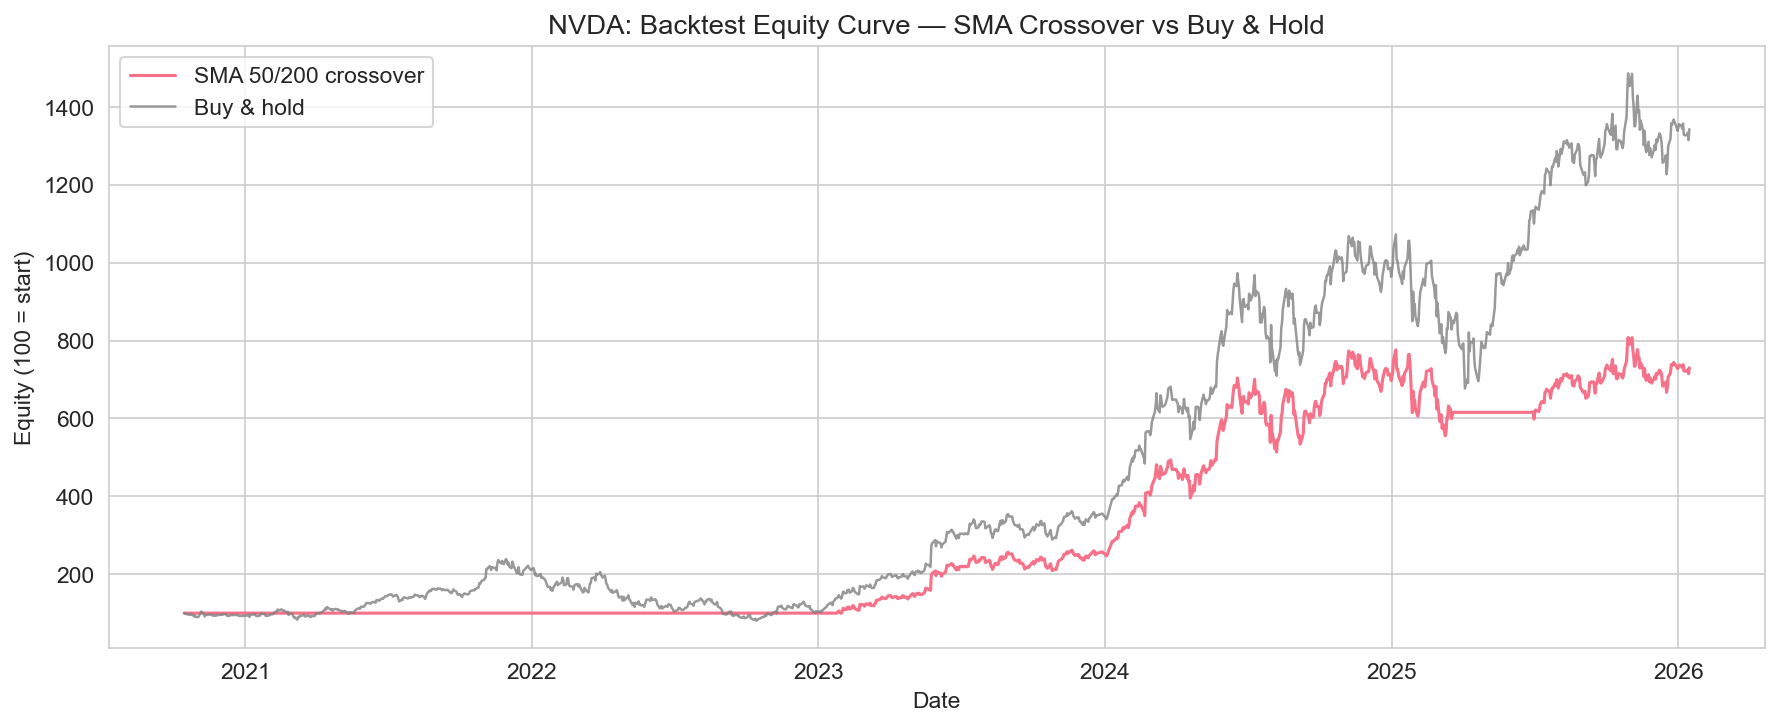
We backtest on NVDA, AMD, VST, and COPX over the full sample. Execution is assumed at the close on the signal day; no transaction costs or slippage. Below: NVDA price with SMA 50/200 and crossover markers, NVDA RSI_14 with 30/70 bands and buy/sell signals, and the equity curve of the SMA crossover strategy vs buy-and-hold for NVDA.
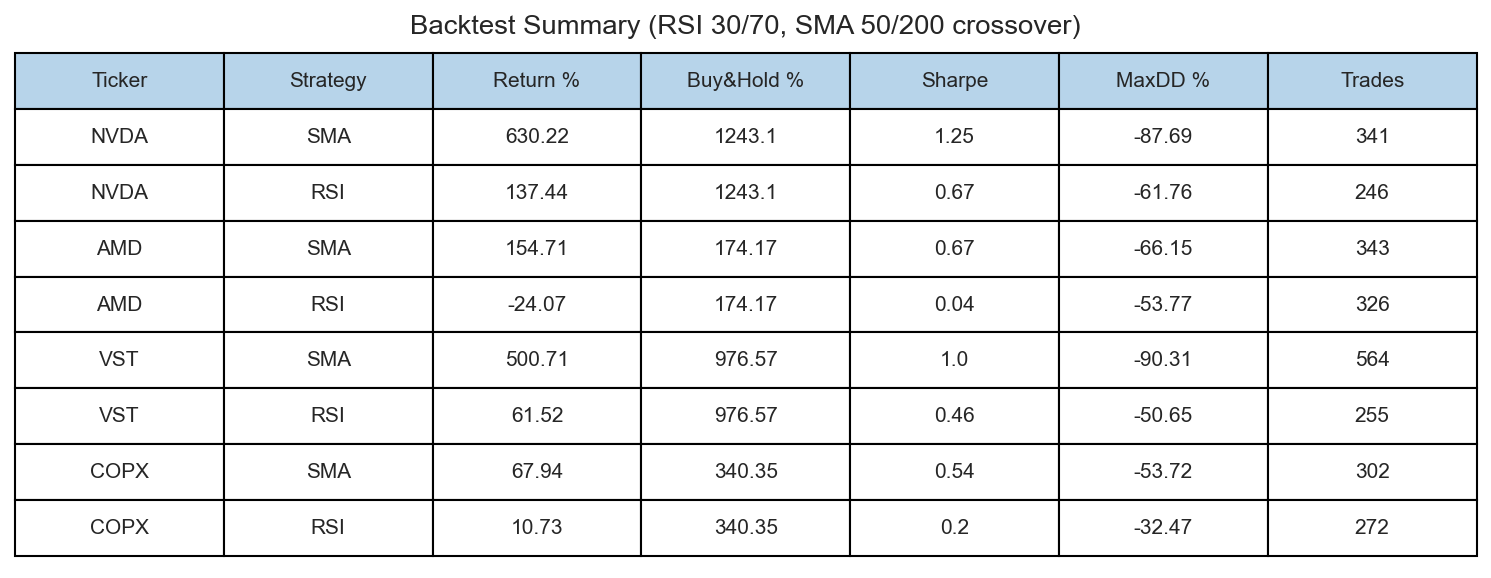
Backtest summary (all four tickers, both strategies):
| Ticker | Strategy | Return % | Buy & Hold % | Sharpe | Max DD % | Trades |
|---|---|---|---|---|---|---|
| NVDA | SMA | 630.22 | 1243.1 | 1.25 | −87.69 | 341 |
| NVDA | RSI | 137.44 | 1243.1 | 0.67 | −61.76 | 246 |
| AMD | SMA | 154.71 | 174.17 | 0.67 | −66.15 | 343 |
| AMD | RSI | −24.07 | 174.17 | 0.04 | −53.77 | 326 |
| VST | SMA | 500.71 | 976.57 | 1.0 | −90.31 | 564 |
| VST | RSI | 61.52 | 976.57 | 0.46 | −50.65 | 255 |
| COPX | SMA | 67.94 | 340.35 | 0.54 | −53.72 | 302 |
| COPX | RSI | 10.73 | 340.35 | 0.2 | −32.47 | 272 |
For NVDA and AMD, buy-and-hold beats both tactical strategies in total return over this period; the SMA crossover on NVDA still captures a large upside but with a deep drawdown. VST (utilities): SMA and RSI underperform buy-and-hold; COPX: both strategies underperform buy-and-hold. So in this sample, simple RSI and SMA crossover rules do not systematically improve on buy-and-hold for these names; they can reduce participation in strong trends (e.g. NVDA) and add turnover. Results are illustrative and depend on the chosen parameters and execution assumptions.
Limitations
This analysis is not financial advice. It is a descriptive and educational exercise on a single dataset. We do not incorporate fundamentals, news, or macro data. The dataset may contain gaps or adjustments; alignment of tickers to common dates and the choice of baskets affect the results. Lead-lag and backtest conclusions are sample-dependent; transaction costs, taxes, and execution quality would reduce strategy returns. Any investment decision should use multiple sources and professional advice.
Conclusion
Using the AI Chips, Energy and Nuclear Index 2026 Kaggle dataset, we analyzed 45,925 date–ticker records from October 2020 to January 2026 across 37 tickers and 9 sectors. Sector rotation analysis shows Tech (NVDA, AMD, MSFT, GOOGL) strongly outperforming Utilities (VST, NEE, CEG) over the period, with relative strength trending up; high-volatility regimes were marked and show pullbacks in both baskets. Lead-lag cross-correlations of COPX and CCJ vs NVDA are strongest at lag zero (contemporaneous), with no clear multi-day commodity lead in this sample. Volatility in AI names (NVDA, AMD, SMCI, PLTR, SNOW) is higher and more clustered than in stable Utilities/Energy (VST, NEE, CEG, ET). Technical backtests of RSI (30/70) and SMA 50/200 crossover on NVDA, AMD, VST, and COPX do not beat buy-and-hold in total return over the sample; they illustrate the trade-off between tactical signals and trend participation. All results are indicative and depend on the data and methods used.
Data and methodology
The analysis uses the AI Chips, Energy and Nuclear Index 2026 dataset (Kaggle: kanchana1990/ai-chips-energy-and-nuclear-index-2026): daily Date, Ticker, Sector, Industry, Role, Close, Volume, Daily_Turnover, Log_Returns, Volatility_20d, RSI_14, SMA_50, and SMA_200. Dates and numerics were parsed; rows with missing key fields were dropped. Sector rotation uses equal-weighted average log returns by date for Tech and Utility baskets, then cumulative product indexed to 100. Lead-lag uses cross-correlation of aligned daily log returns (scipy). Volatility comparison uses average Volatility_20d by date for AI and Stable groups. Backtests assume long/flat positions with signals at close; no costs. Figures were generated with pandas, matplotlib, seaborn, and scipy. All results are indicative and not a recommendation.


